Latest NFL charts
Each week Gridiron AI charts the NFL from its models and public data: playoff odds, its numbers against the betting line, where the betting money went, fantasy projections against what players scored, and more.
Playoff race
Standings · Week 9 · Tue, Nov 10
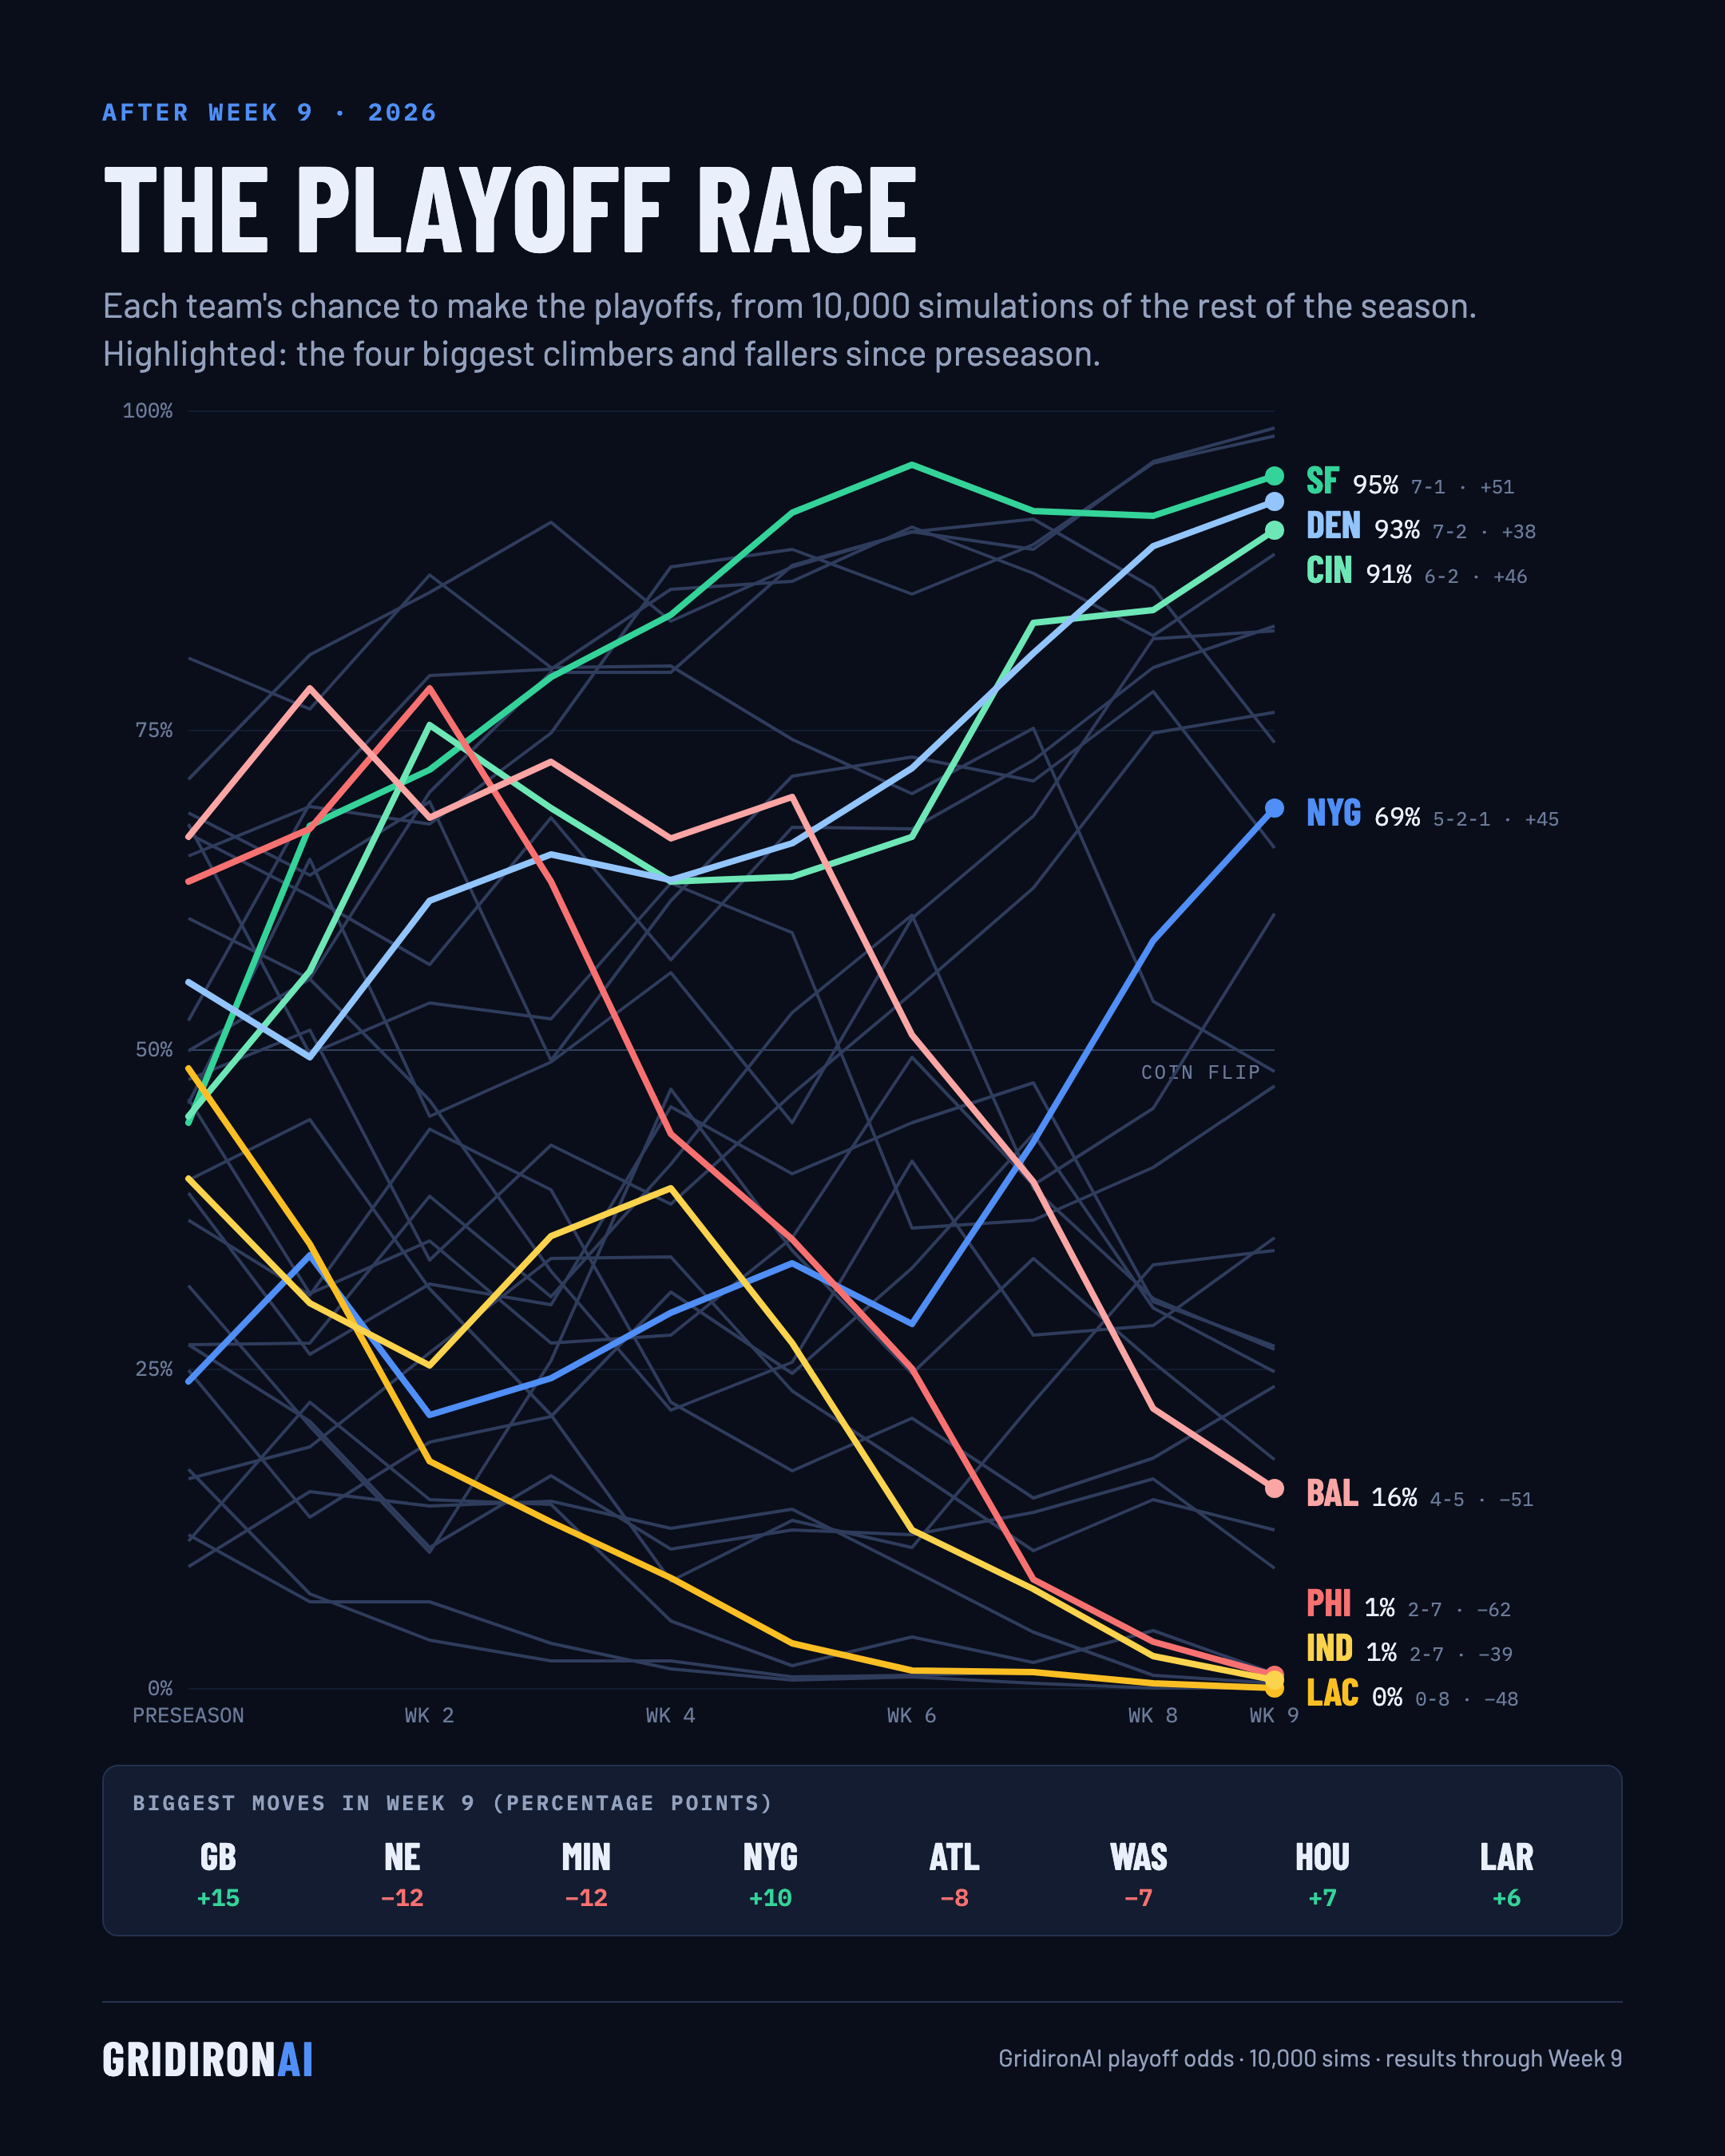
The playoff race after Week 9, from 10,000 simulations of the season:
Climbing: SF 44% → 95%, CIN 45% → 91%, NYG 24% → 69%
Falling: PHI 63% → 1%, BAL 67% → 16%
Biggest Week 9 swing: GB, up 15 points.
| Team | Conf | Record | Playoffs | Division | Since preseason |
|---|---|---|---|---|---|
| BUF | AFC | 7-1 | 99% | 90% | +27 pts |
| JAX | AFC | 6-2 | 98% | 92% | +33 pts |
| SF | NFC | 7-1 | 95% | 82% | +51 pts |
| DEN | AFC | 7-2 | 93% | 59% | +38 pts |
| CIN | AFC | 6-2 | 91% | 60% | +46 pts |
| KC | AFC | 6-2 | 89% | 39% | +37 pts |
| DET | NFC | 6-2 | 83% | 38% | +16 pts |
| CHI | NFC | 7-2 | 83% | 29% | +37 pts |
| PIT | AFC | 6-2 | 76% | 33% | +29 pts |
| MIN | NFC | 6-2 | 74% | 22% | +24 pts |
| NYG | NFC | 5-2-1 | 69% | 67% | +45 pts |
| NE | AFC | 5-4 | 66% | 10% | −3 pts |
| GB | NFC | 6-3 | 61% | 12% | +15 pts |
| SEA | NFC | 5-4 | 48% | 10% | −32 pts |
| LA | NFC | 5-4 | 47% | 7% | −21 pts |
| HOU | AFC | 3-5 | 35% | 7% | −25 pts |
| TB | NFC | 3-6 | 34% | 34% | −5 pts |
| DAL | NFC | 4-5 | 27% | 24% | −12 pts |
| CAR | NFC | 3-5 | 26% | 26% | −0 pts |
| CLE | AFC | 5-4 | 25% | 5% | −0 pts |
| NO | NFC | 3-5 | 24% | 23% | −13 pts |
| ATL | NFC | 3-6 | 18% | 17% | −14 pts |
| BAL | AFC | 4-5 | 16% | 3% | −51 pts |
| LV | AFC | 4-5 | 12% | 2% | −4 pts |
| WAS | NFC | 2-5-1 | 9% | 9% | −17 pts |
| ARI | NFC | 3-6 | 1% | 0% | −10 pts |
| PHI | NFC | 2-7 | 1% | 1% | −62 pts |
| IND | AFC | 2-7 | 1% | 0% | −39 pts |
| NYJ | AFC | 2-7 | 0% | 0% | −9 pts |
| MIA | AFC | 1-7 | 0% | 0% | −17 pts |
| LAC | AFC | 0-8 | 0% | 0% | −48 pts |
| TEN | AFC | 1-7 | 0% | 0% | −12 pts |
Team tiers: offense vs. defense by EPA per play
Teams & QBs · Week 9 · Tue, Nov 10
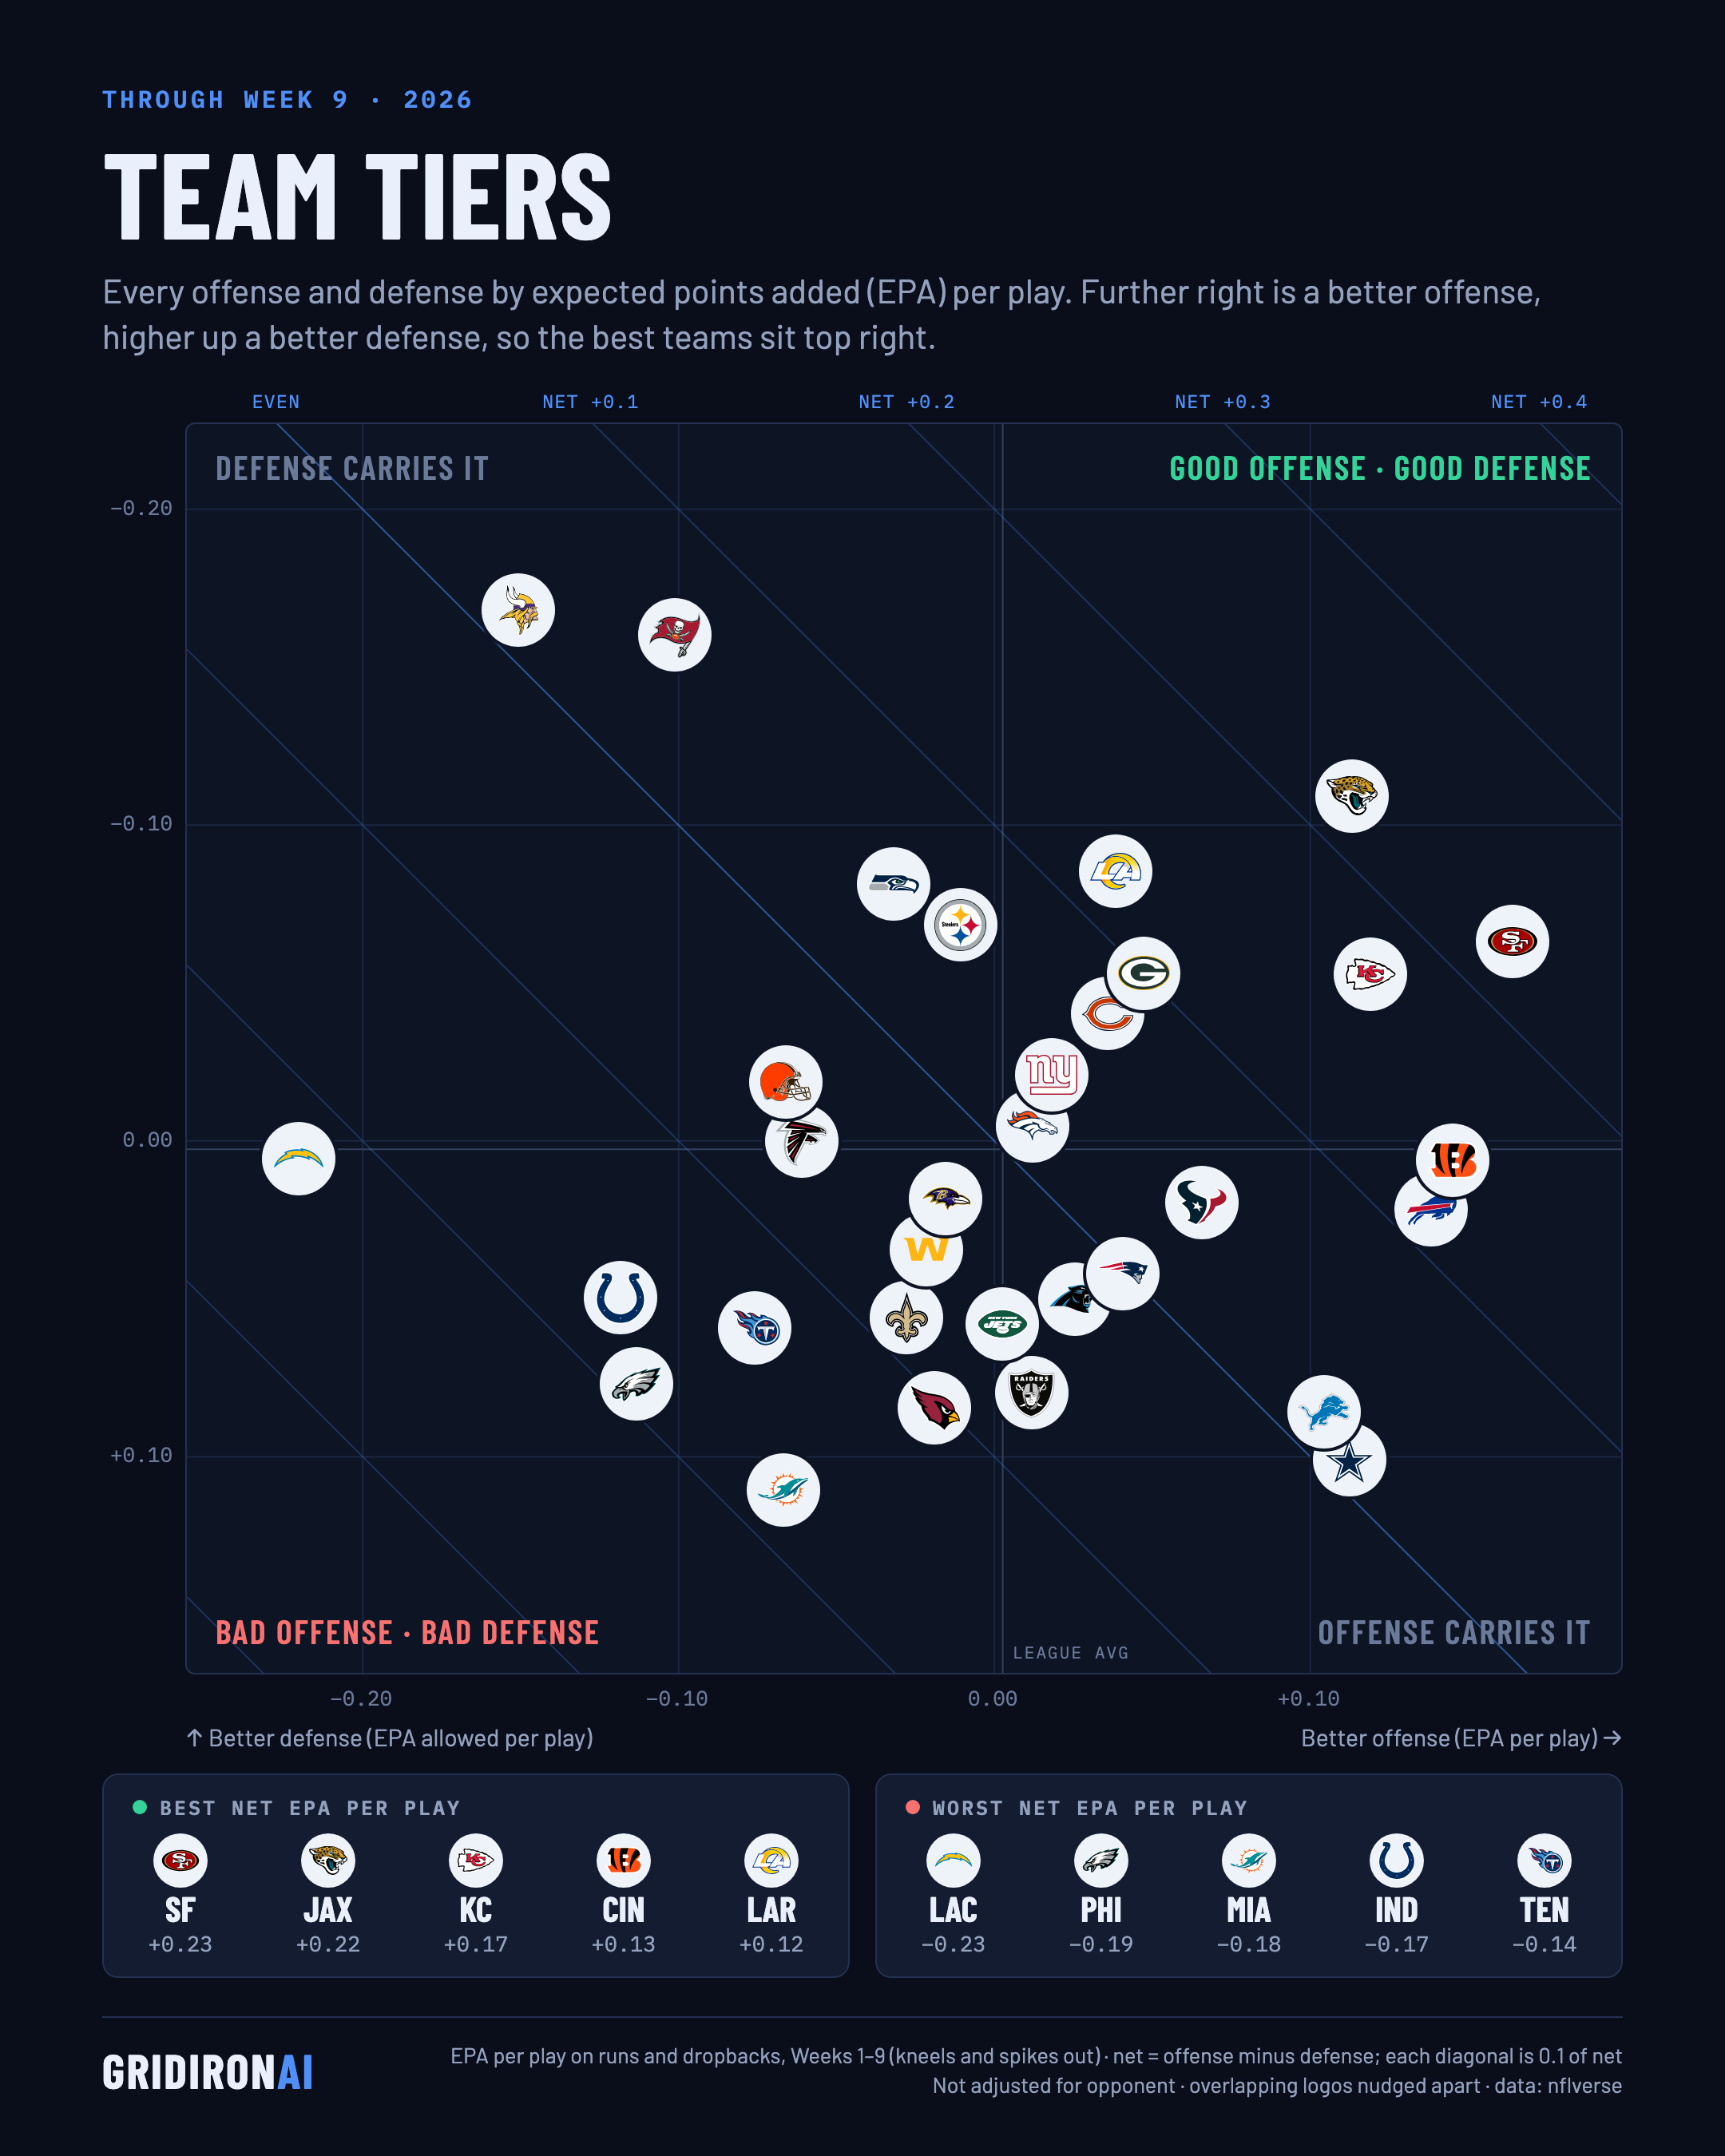
Team tiers through Week 9: every offense and defense by EPA per play (expected points added, how much each play moved a team's scoring chances).
Best net (offense minus defense): SF +0.23, JAX +0.22, KC +0.17.
Worst: LAC −0.23, PHI −0.19, MIA −0.18.
| Team | Offense EPA/play | Defense EPA/play allowed | Net | Offense success rate | Success rate allowed |
|---|---|---|---|---|---|
| SF | +0.16 | −0.06 | +0.23 | 52% | 43% |
| JAX | +0.11 | −0.11 | +0.22 | 46% | 41% |
| KC | +0.12 | −0.05 | +0.17 | 48% | 41% |
| CIN | +0.14 | +0.01 | +0.13 | 51% | 45% |
| LAR | +0.04 | −0.09 | +0.12 | 48% | 41% |
| BUF | +0.14 | +0.02 | +0.12 | 48% | 46% |
| GB | +0.04 | −0.05 | +0.10 | 41% | 44% |
| CHI | +0.04 | −0.04 | +0.08 | 47% | 41% |
| TB | −0.10 | −0.16 | +0.06 | 41% | 40% |
| PIT | −0.01 | −0.07 | +0.06 | 43% | 42% |
| SEA | −0.03 | −0.08 | +0.05 | 42% | 39% |
| HOU | +0.07 | +0.02 | +0.05 | 44% | 41% |
| NYG | +0.02 | −0.02 | +0.03 | 41% | 41% |
| DEN | +0.01 | −0.01 | +0.02 | 41% | 42% |
| DET | +0.10 | +0.09 | +0.02 | 49% | 44% |
| MIN | −0.15 | −0.17 | +0.02 | 37% | 37% |
| DAL | +0.11 | +0.10 | +0.01 | 47% | 46% |
| NE | +0.04 | +0.04 | 0.00 | 45% | 44% |
| CAR | +0.03 | +0.05 | −0.02 | 42% | 45% |
| BAL | −0.02 | +0.02 | −0.04 | 44% | 45% |
| CLE | −0.07 | −0.02 | −0.05 | 42% | 43% |
| WAS | −0.02 | +0.03 | −0.05 | 41% | 46% |
| NYJ | 0.00 | +0.06 | −0.06 | 45% | 47% |
| ATL | −0.06 | 0.00 | −0.06 | 44% | 44% |
| LV | +0.01 | +0.08 | −0.07 | 44% | 48% |
| NO | −0.03 | +0.06 | −0.08 | 42% | 47% |
| ARI | −0.02 | +0.08 | −0.10 | 44% | 44% |
| TEN | −0.08 | +0.06 | −0.14 | 42% | 46% |
| IND | −0.12 | +0.05 | −0.17 | 42% | 43% |
| MIA | −0.07 | +0.11 | −0.18 | 39% | 48% |
| PHI | −0.11 | +0.08 | −0.19 | 36% | 44% |
| LAC | −0.22 | +0.01 | −0.23 | 36% | 44% |
Pass rate over expected
Teams & QBs · Week 9 · Tue, Nov 10
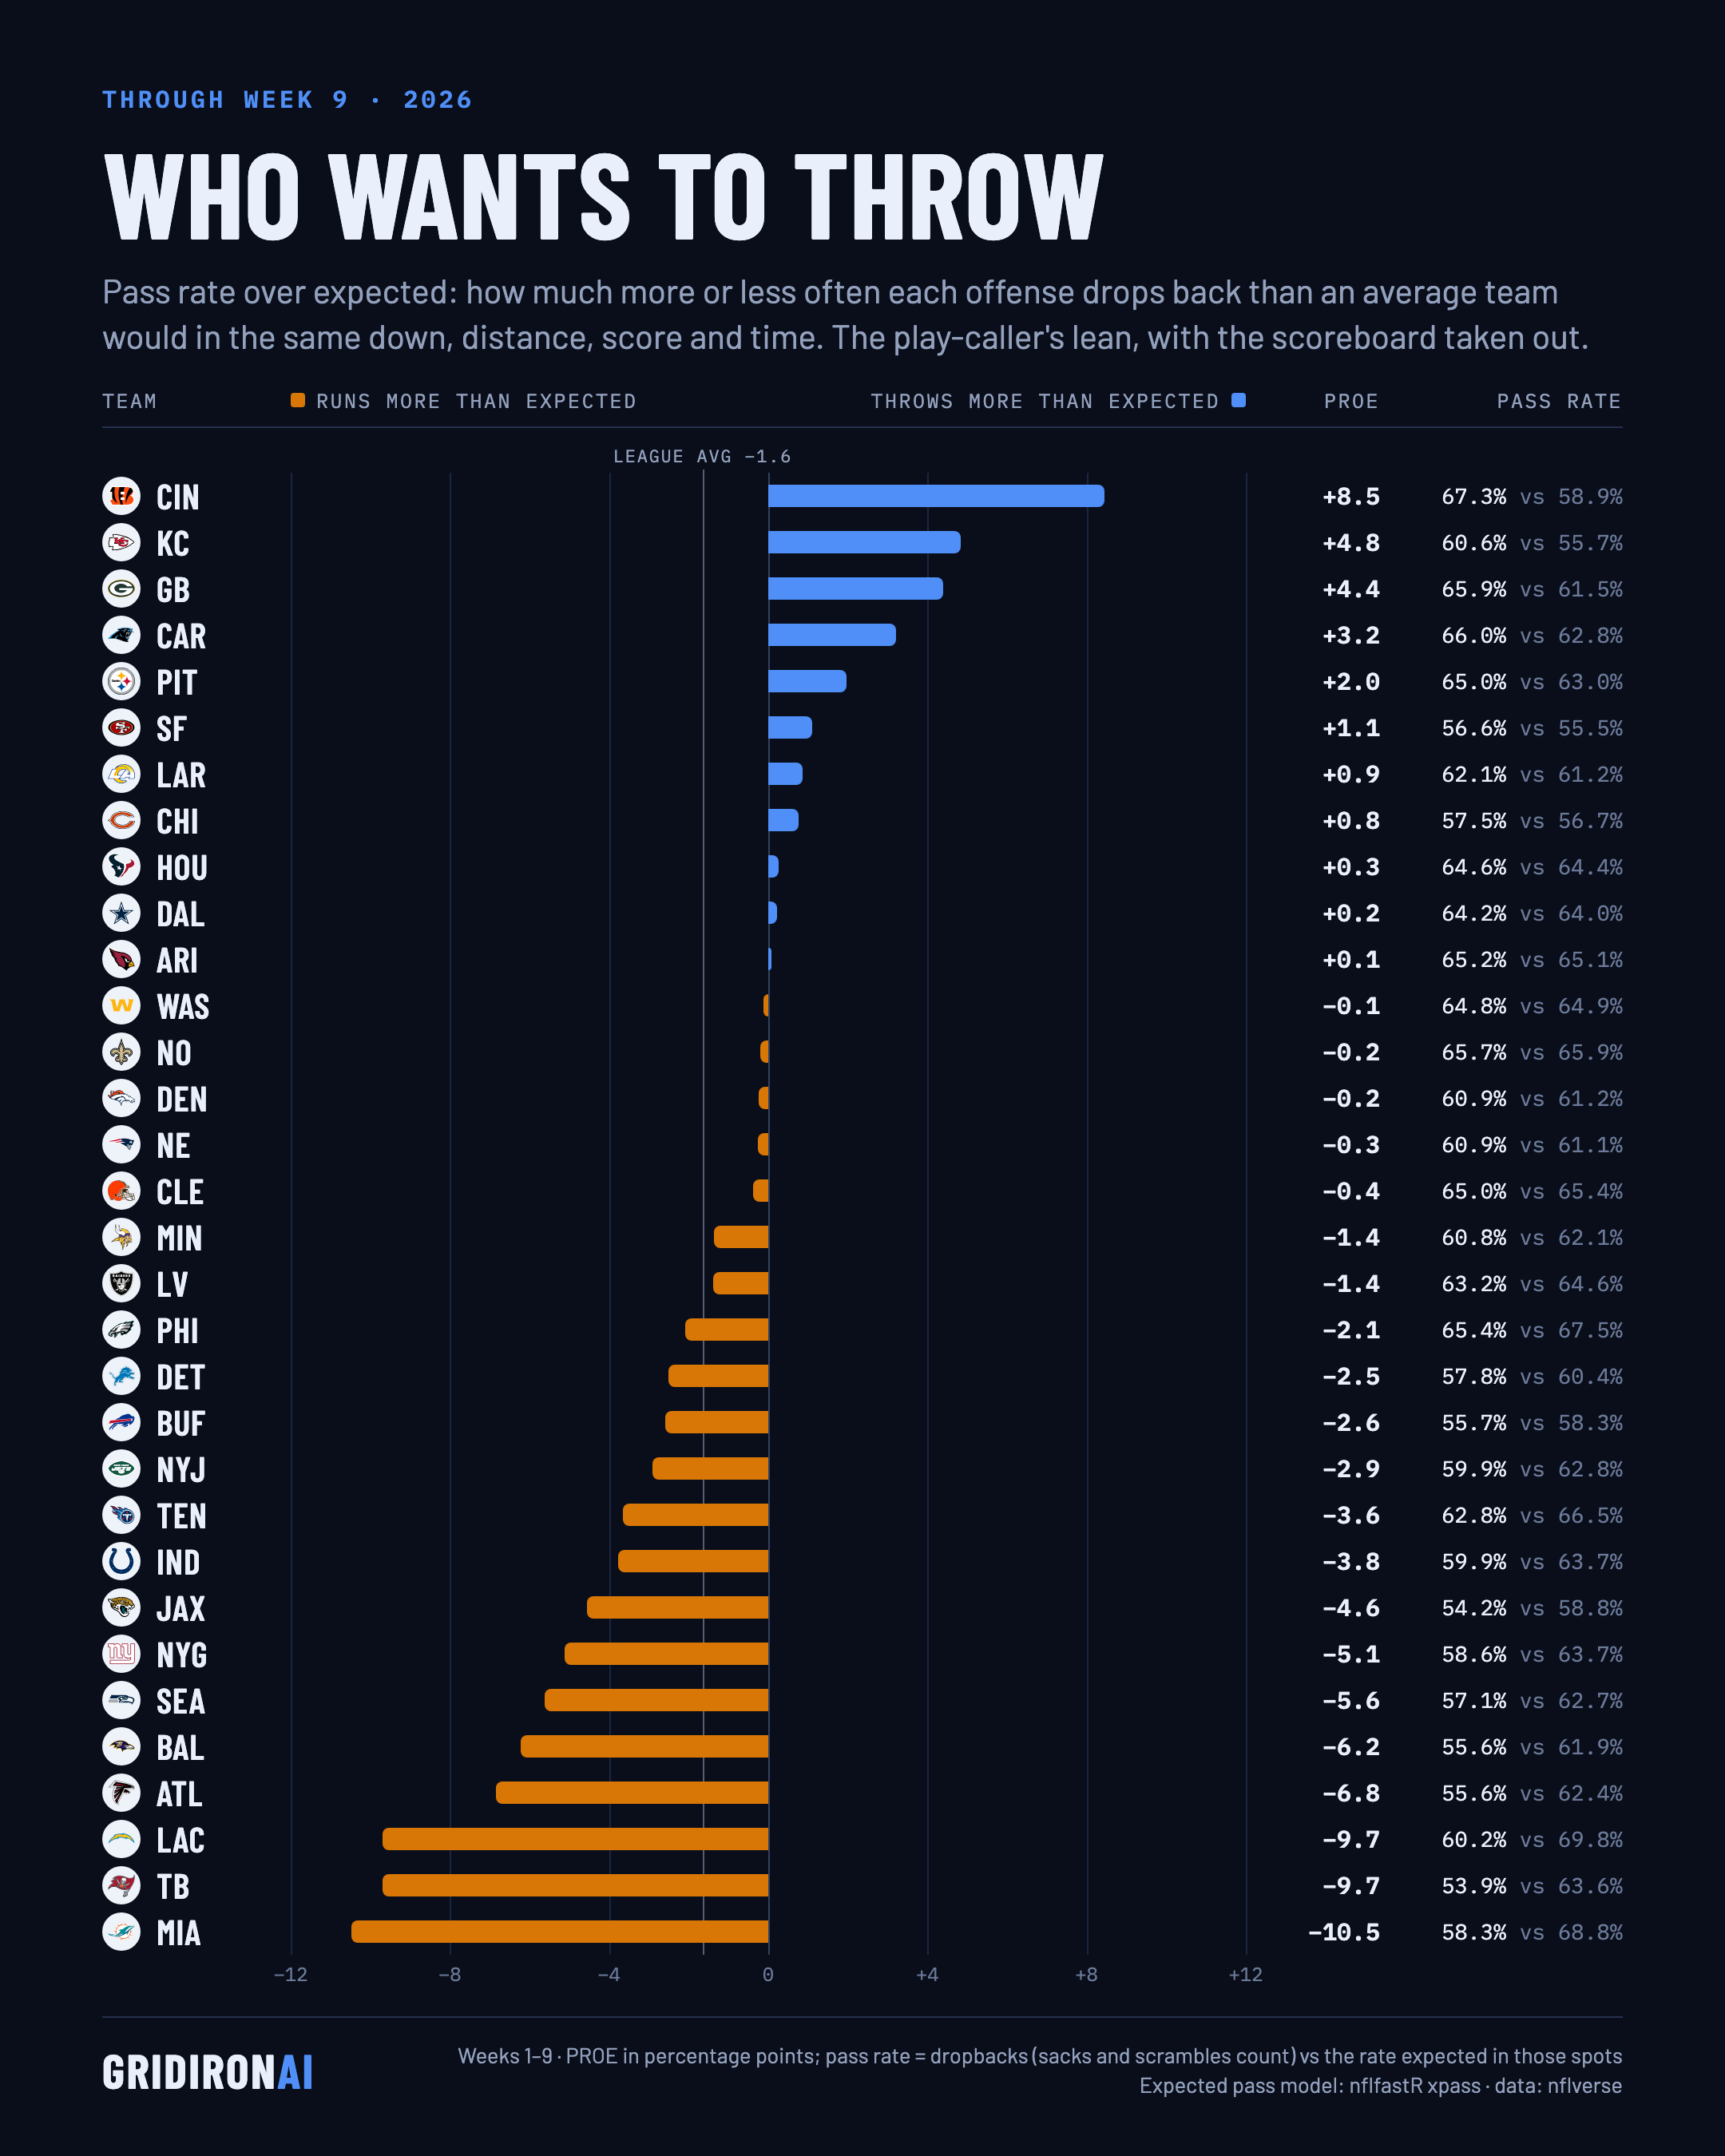
Pass rate over expected through Week 9: how much more or less often each offense drops back to pass than an average team would in the same down, distance, score and time, in percentage points.
Most pass-heavy: CIN (+8.5), KC (+4.8), GB (+4.4).
Most run-heavy: MIA (−10.5), TB (−9.7), LAC (−9.7).
It measures the play-caller's lean, not how well the passes work.
| Team | Pass rate over expected | Pass rate | Expected | Plays |
|---|---|---|---|---|
| CIN | +8.5 | 67.3% | 58.9% | 499 |
| KC | +4.8 | 60.6% | 55.7% | 502 |
| GB | +4.4 | 65.9% | 61.5% | 583 |
| CAR | +3.2 | 66.0% | 62.8% | 550 |
| PIT | +2.0 | 65.0% | 63.0% | 517 |
| SF | +1.1 | 56.6% | 55.5% | 484 |
| LAR | +0.9 | 62.1% | 61.2% | 620 |
| CHI | +0.8 | 57.5% | 56.7% | 649 |
| HOU | +0.3 | 64.6% | 64.4% | 520 |
| DAL | +0.2 | 64.2% | 64.0% | 618 |
| ARI | +0.1 | 65.2% | 65.1% | 629 |
| WAS | −0.1 | 64.8% | 64.9% | 514 |
| NO | −0.2 | 65.7% | 65.9% | 548 |
| DEN | −0.2 | 60.9% | 61.2% | 553 |
| NE | −0.3 | 60.9% | 61.1% | 570 |
| CLE | −0.4 | 65.0% | 65.4% | 577 |
| MIN | −1.4 | 60.8% | 62.1% | 469 |
| LV | −1.4 | 63.2% | 64.6% | 574 |
| PHI | −2.1 | 65.4% | 67.5% | 569 |
| DET | −2.5 | 57.8% | 60.4% | 536 |
| BUF | −2.6 | 55.7% | 58.3% | 531 |
| NYJ | −2.9 | 59.9% | 62.8% | 544 |
| TEN | −3.6 | 62.8% | 66.5% | 471 |
| IND | −3.8 | 59.9% | 63.7% | 591 |
| JAX | −4.6 | 54.2% | 58.8% | 483 |
| NYG | −5.1 | 58.6% | 63.7% | 541 |
| SEA | −5.6 | 57.1% | 62.7% | 583 |
| BAL | −6.2 | 55.6% | 61.9% | 550 |
| ATL | −6.8 | 55.6% | 62.4% | 547 |
| LAC | −9.7 | 60.2% | 69.8% | 527 |
| TB | −9.7 | 53.9% | 63.6% | 583 |
| MIA | −10.5 | 58.3% | 68.8% | 475 |
Model vs. Vegas
Betting · Week 10 · Tue, Nov 10
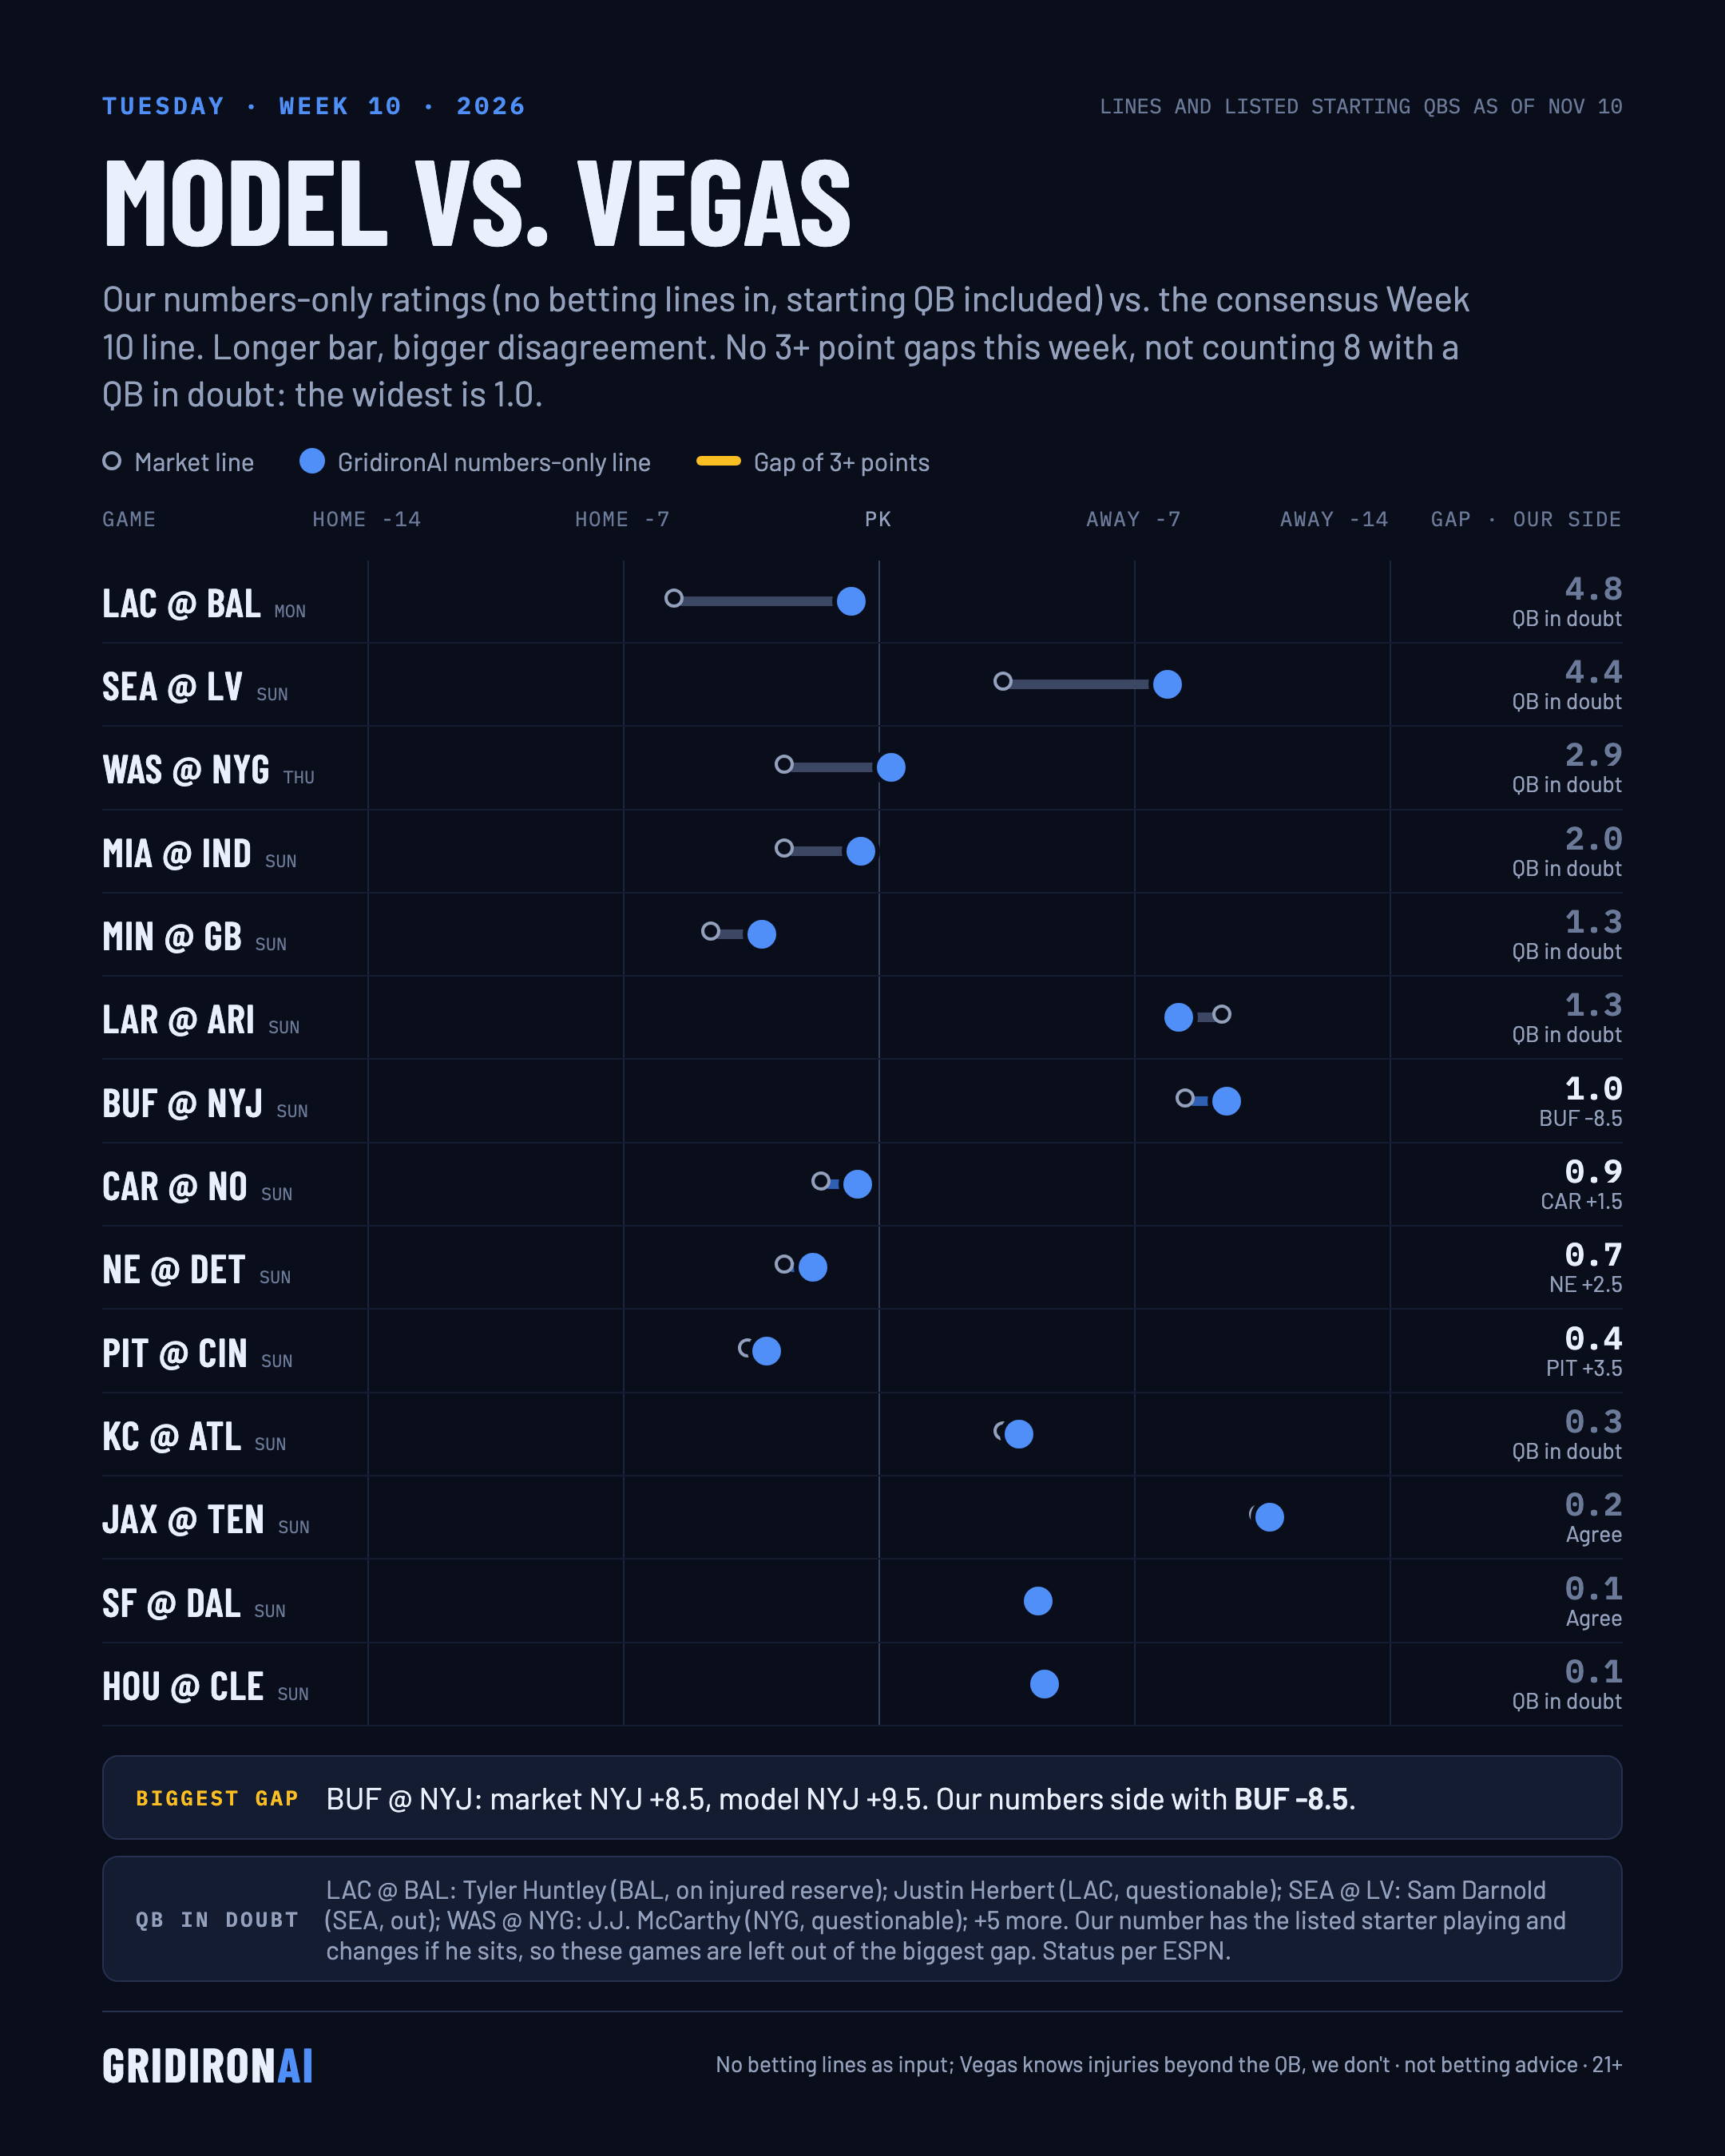
Model vs. Vegas, Week 10: our numbers-only ratings vs. the line. No betting lines go into our model, just results and the starting QB.
Biggest gap: BUF @ NYJ. Market BUF -8.5, our numbers BUF -9.5.
Starting QB in doubt, per ESPN: LAC @ BAL, Tyler Huntley (BAL, on injured reserve); Justin Herbert (LAC, questionable); SEA @ LV, Sam Darnold (SEA, out); WAS @ NYG, J.J. McCarthy (NYG, questionable); MIA @ IND, Malik Willis (MIA, questionable); MIN @ GB, Kyler Murray (MIN, questionable); LAR @ ARI, Gardner Minshew (ARI, doubtful); KC @ ATL, Patrick Mahomes (KC, questionable); HOU @ CLE, Deshaun Watson (CLE, questionable). Our number has the listed starter playing and changes if he sits, so those games are left out of the biggest gap above.
Why leave the lines out? To see where the numbers alone disagree with the market. Vegas knows injuries beyond the QB and we don't, so these aren't picks.
| Game | Kickoff | Line (home) | Ours (home) | Gap | Starting QB in doubt (ESPN status) |
|---|---|---|---|---|---|
| LAC @ BAL | MON 20:15 | -5.5 | -0.8 | 4.8 | Tyler Huntley (BAL, on injured reserve); Justin Herbert (LAC, questionable) |
| SEA @ LV | SUN 16:05 | +3.5 | +7.9 | 4.4 | Sam Darnold (SEA, out) |
| WAS @ NYG | THU 20:15 | -2.5 | +0.3 | 2.9 | J.J. McCarthy (NYG, questionable) |
| MIA @ IND | SUN 13:00 | -2.5 | -0.5 | 2.0 | Malik Willis (MIA, questionable) |
| MIN @ GB | SUN 13:00 | -4.5 | -3.2 | 1.3 | Kyler Murray (MIN, questionable) |
| LAR @ ARI | SUN 16:05 | +9.5 | +8.2 | 1.3 | Gardner Minshew (ARI, doubtful) |
| BUF @ NYJ | SUN 13:00 | +8.5 | +9.5 | 1.0 | |
| CAR @ NO | SUN 13:00 | -1.5 | -0.6 | 0.9 | |
| NE @ DET | SUN 09:30 | -2.5 | -1.8 | 0.7 | |
| PIT @ CIN | SUN 20:20 | -3.5 | -3.1 | 0.4 | |
| KC @ ATL | SUN 13:00 | +3.5 | +3.8 | 0.3 | Patrick Mahomes (KC, questionable) |
| JAX @ TEN | SUN 13:00 | +10.5 | +10.7 | 0.2 | |
| SF @ DAL | SUN 16:25 | +4.5 | +4.4 | 0.1 | |
| HOU @ CLE | SUN 13:00 | +4.5 | +4.6 | 0.1 | Deshaun Watson (CLE, questionable) |
Implied team totals
Betting · Week 10 · Tue, Nov 10
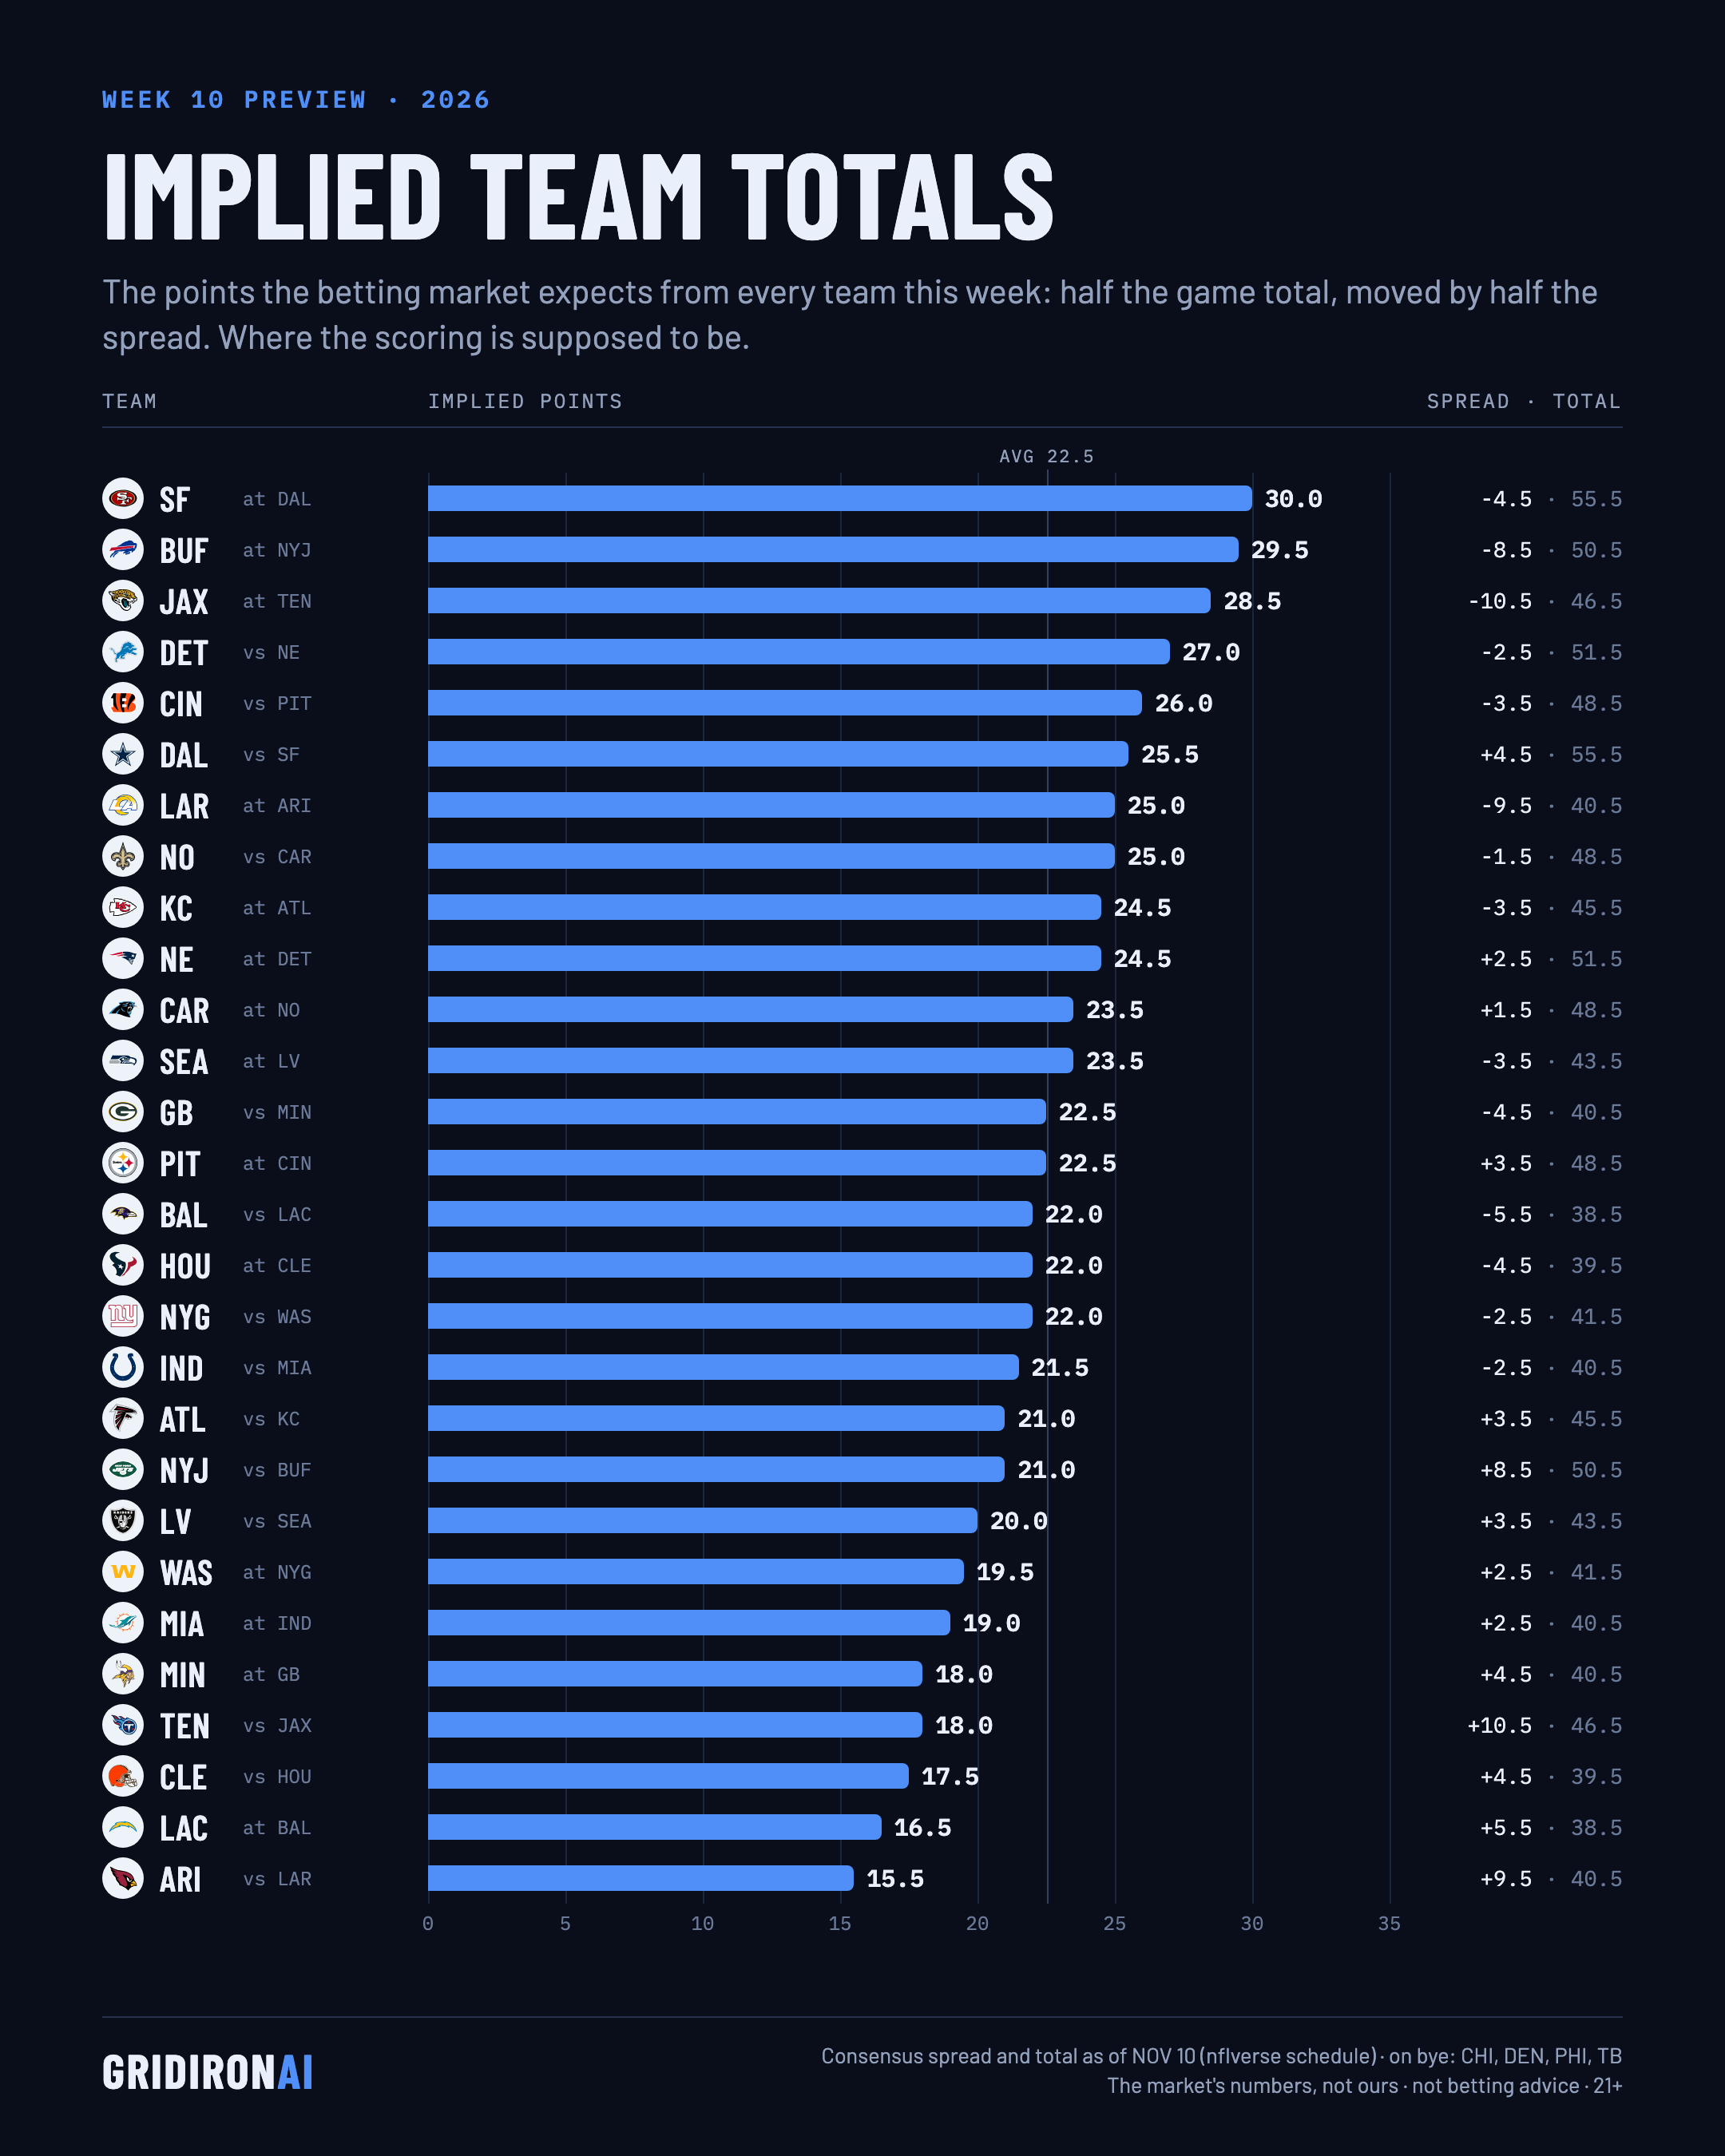
Implied team totals for Week 10: the points the betting market expects from each team, from the game total and the spread (half the total, plus or minus half the spread).
Highest: SF 30.0 (at DAL), BUF 29.5 (at NYJ), JAX 28.5 (at TEN).
Lowest: ARI 15.5 (vs LAR), LAC 16.5 (at BAL), CLE 17.5 (vs HOU).
On bye: CHI, DEN, PHI, TB.
The market's numbers, not ours, and not picks.
| Team | Opponent | Implied points | Spread | Game total |
|---|---|---|---|---|
| SF | at DAL | 30.0 | -4.5 | 55.5 |
| BUF | at NYJ | 29.5 | -8.5 | 50.5 |
| JAX | at TEN | 28.5 | -10.5 | 46.5 |
| DET | vs NE | 27.0 | -2.5 | 51.5 |
| CIN | vs PIT | 26.0 | -3.5 | 48.5 |
| DAL | vs SF | 25.5 | +4.5 | 55.5 |
| LAR | at ARI | 25.0 | -9.5 | 40.5 |
| NO | vs CAR | 25.0 | -1.5 | 48.5 |
| KC | at ATL | 24.5 | -3.5 | 45.5 |
| NE | at DET | 24.5 | +2.5 | 51.5 |
| CAR | at NO | 23.5 | +1.5 | 48.5 |
| SEA | at LV | 23.5 | -3.5 | 43.5 |
| GB | vs MIN | 22.5 | -4.5 | 40.5 |
| PIT | at CIN | 22.5 | +3.5 | 48.5 |
| BAL | vs LAC | 22.0 | -5.5 | 38.5 |
| HOU | at CLE | 22.0 | -4.5 | 39.5 |
| NYG | vs WAS | 22.0 | -2.5 | 41.5 |
| IND | vs MIA | 21.5 | -2.5 | 40.5 |
| ATL | vs KC | 21.0 | +3.5 | 45.5 |
| NYJ | vs BUF | 21.0 | +8.5 | 50.5 |
| LV | vs SEA | 20.0 | +3.5 | 43.5 |
| WAS | at NYG | 19.5 | +2.5 | 41.5 |
| MIA | at IND | 19.0 | +2.5 | 40.5 |
| MIN | at GB | 18.0 | +4.5 | 40.5 |
| TEN | vs JAX | 18.0 | +10.5 | 46.5 |
| CLE | vs HOU | 17.5 | +4.5 | 39.5 |
| LAC | at BAL | 16.5 | +5.5 | 38.5 |
| ARI | vs LAR | 15.5 | +9.5 | 40.5 |
Where the money went
Betting · Week 10 · Tue, Nov 10
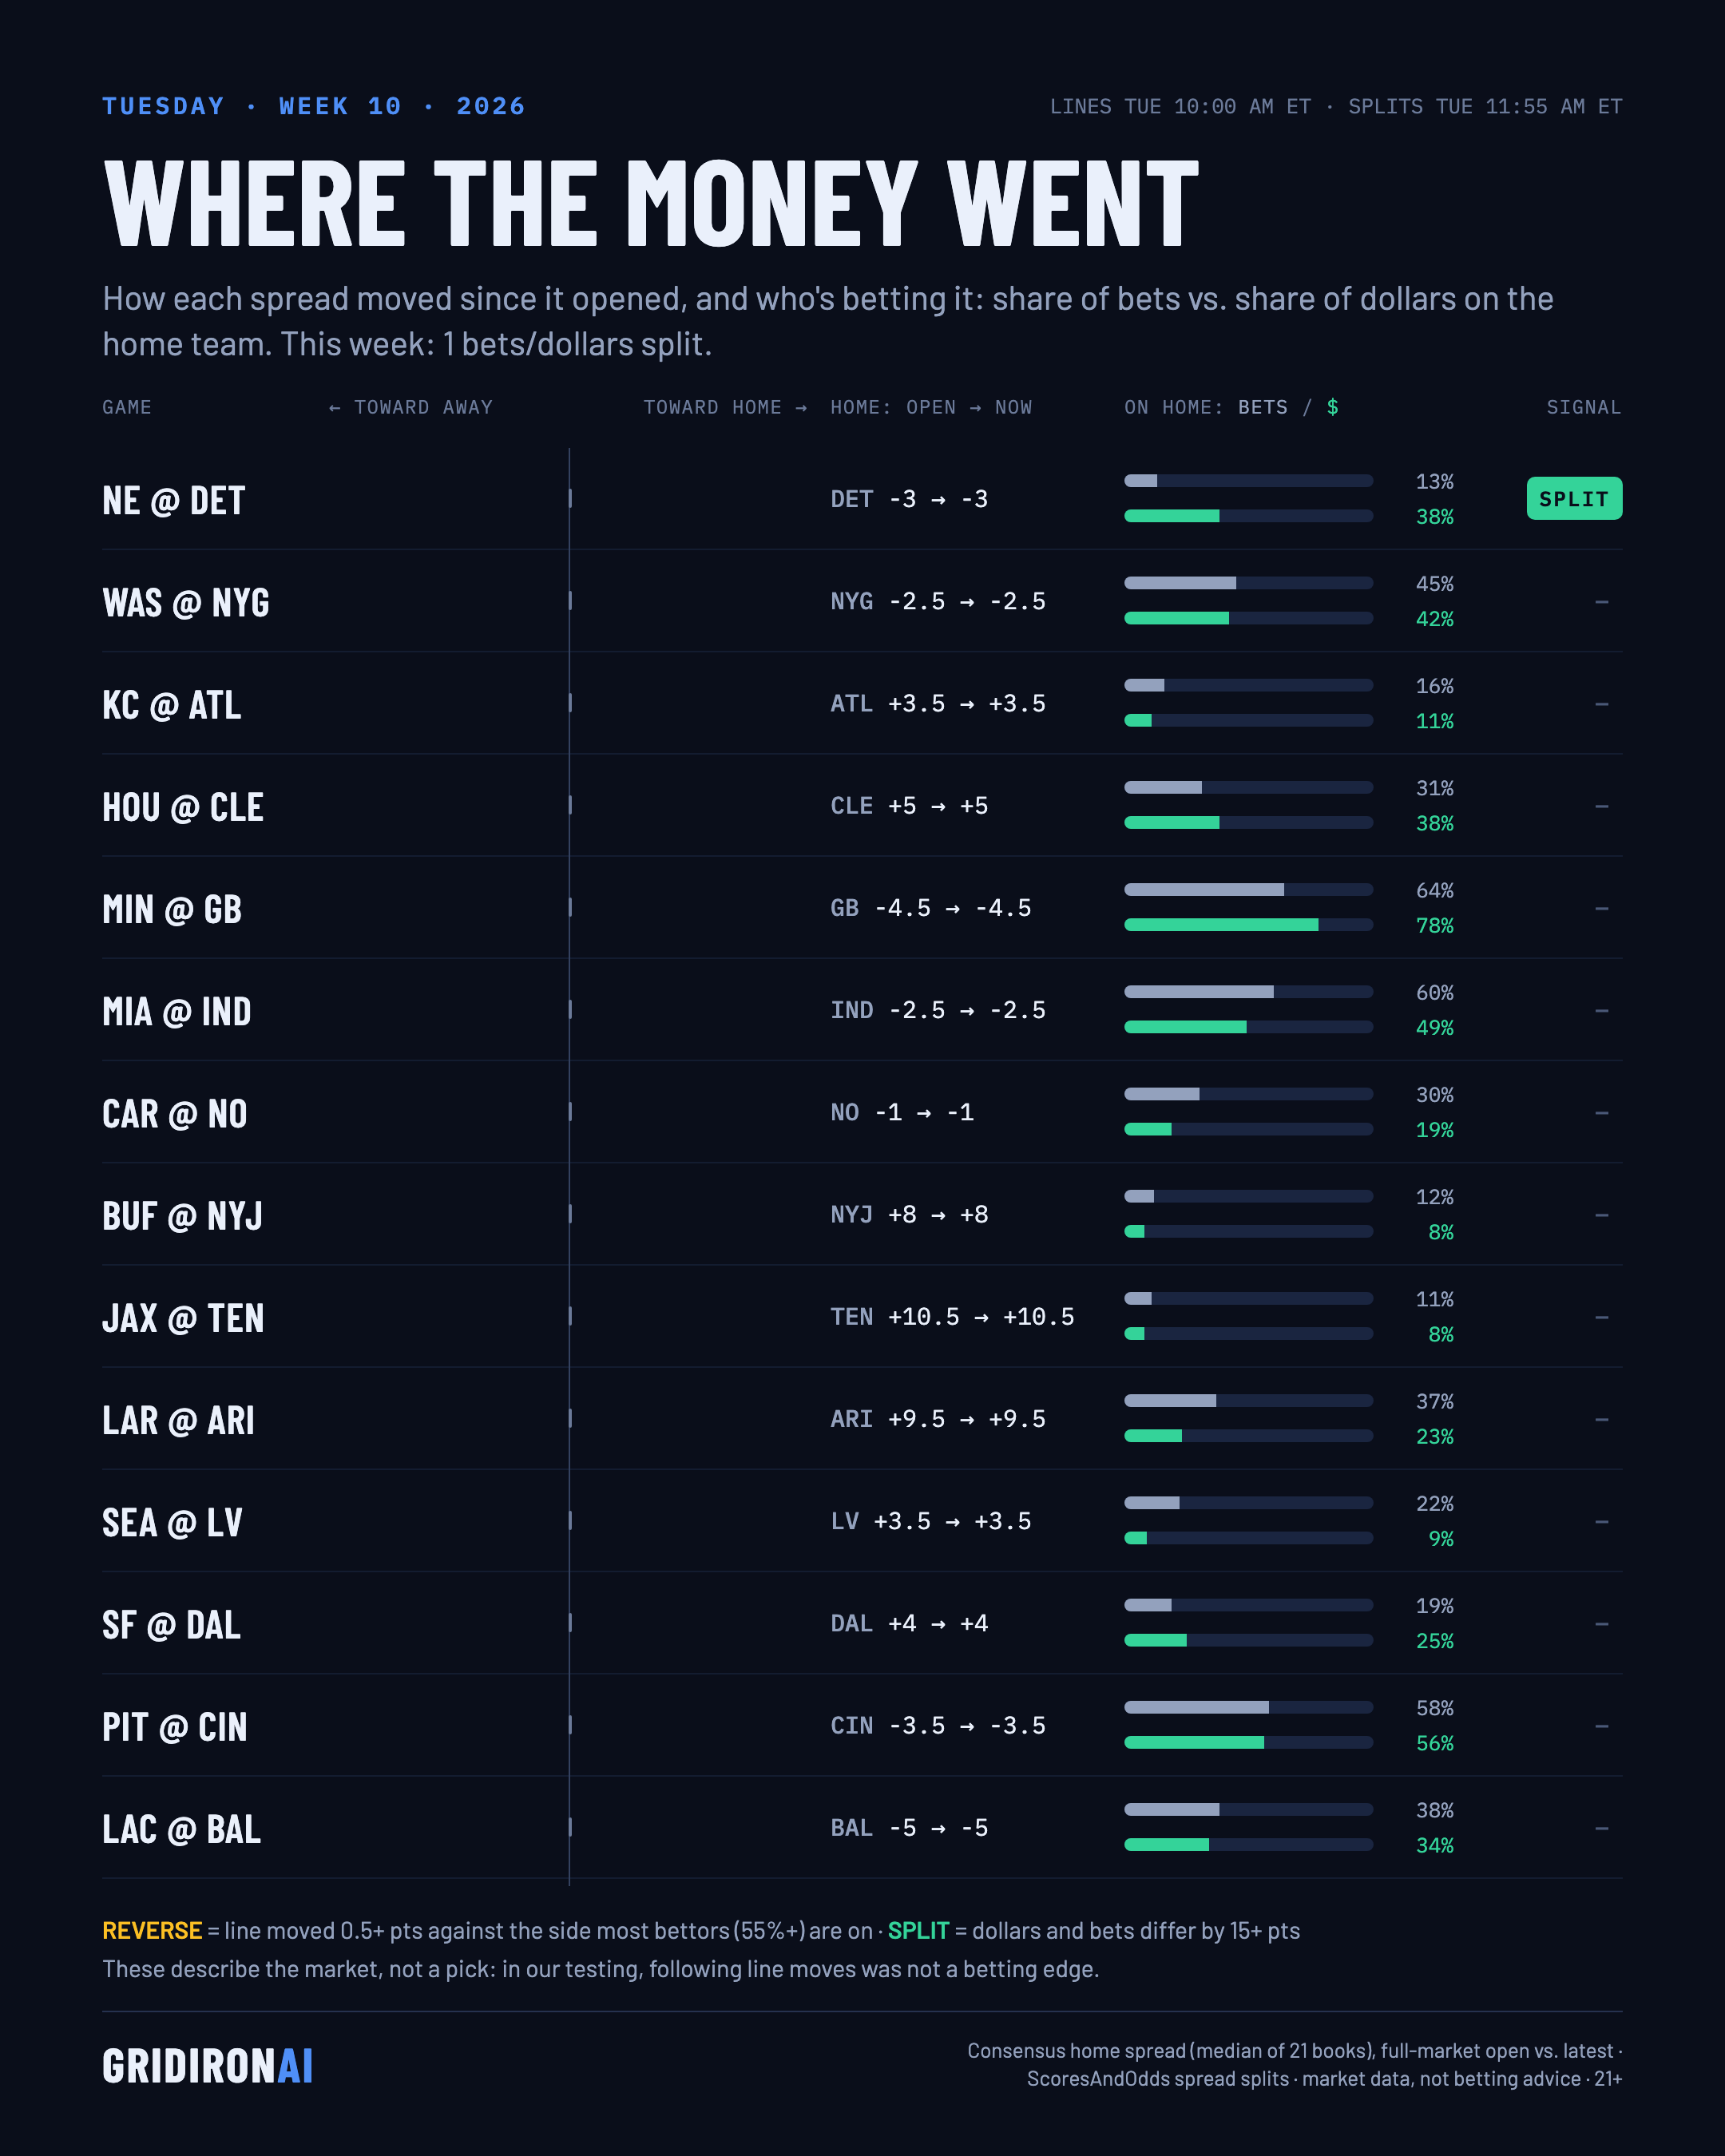
Where the money went, Week 10: how spreads moved, and bets vs. dollars.
No spread has moved off its open yet.
Market data, not picks.
| Game | Open (home) | Now (home) | Bets on home | Money on home | Signal |
|---|---|---|---|---|---|
| NE @ DET | -3 | -3 | 13% | 38% | Split |
| WAS @ NYG | -2.5 | -2.5 | 45% | 42% | |
| KC @ ATL | +3.5 | +3.5 | 16% | 11% | |
| HOU @ CLE | +5 | +5 | 31% | 38% | |
| MIN @ GB | -4.5 | -4.5 | 64% | 78% | |
| MIA @ IND | -2.5 | -2.5 | 60% | 49% | |
| CAR @ NO | -1 | -1 | 30% | 19% | |
| BUF @ NYJ | +8 | +8 | 12% | 8% | |
| JAX @ TEN | +10.5 | +10.5 | 11% | 8% | |
| LAR @ ARI | +9.5 | +9.5 | 37% | 23% | |
| SEA @ LV | +3.5 | +3.5 | 22% | 9% | |
| SF @ DAL | +4 | +4 | 19% | 25% | |
| PIT @ CIN | -3.5 | -3.5 | 58% | 56% | |
| LAC @ BAL | -5 | -5 | 38% | 34% |
Trench watch
Trenches · Week 10 · Tue, Nov 10
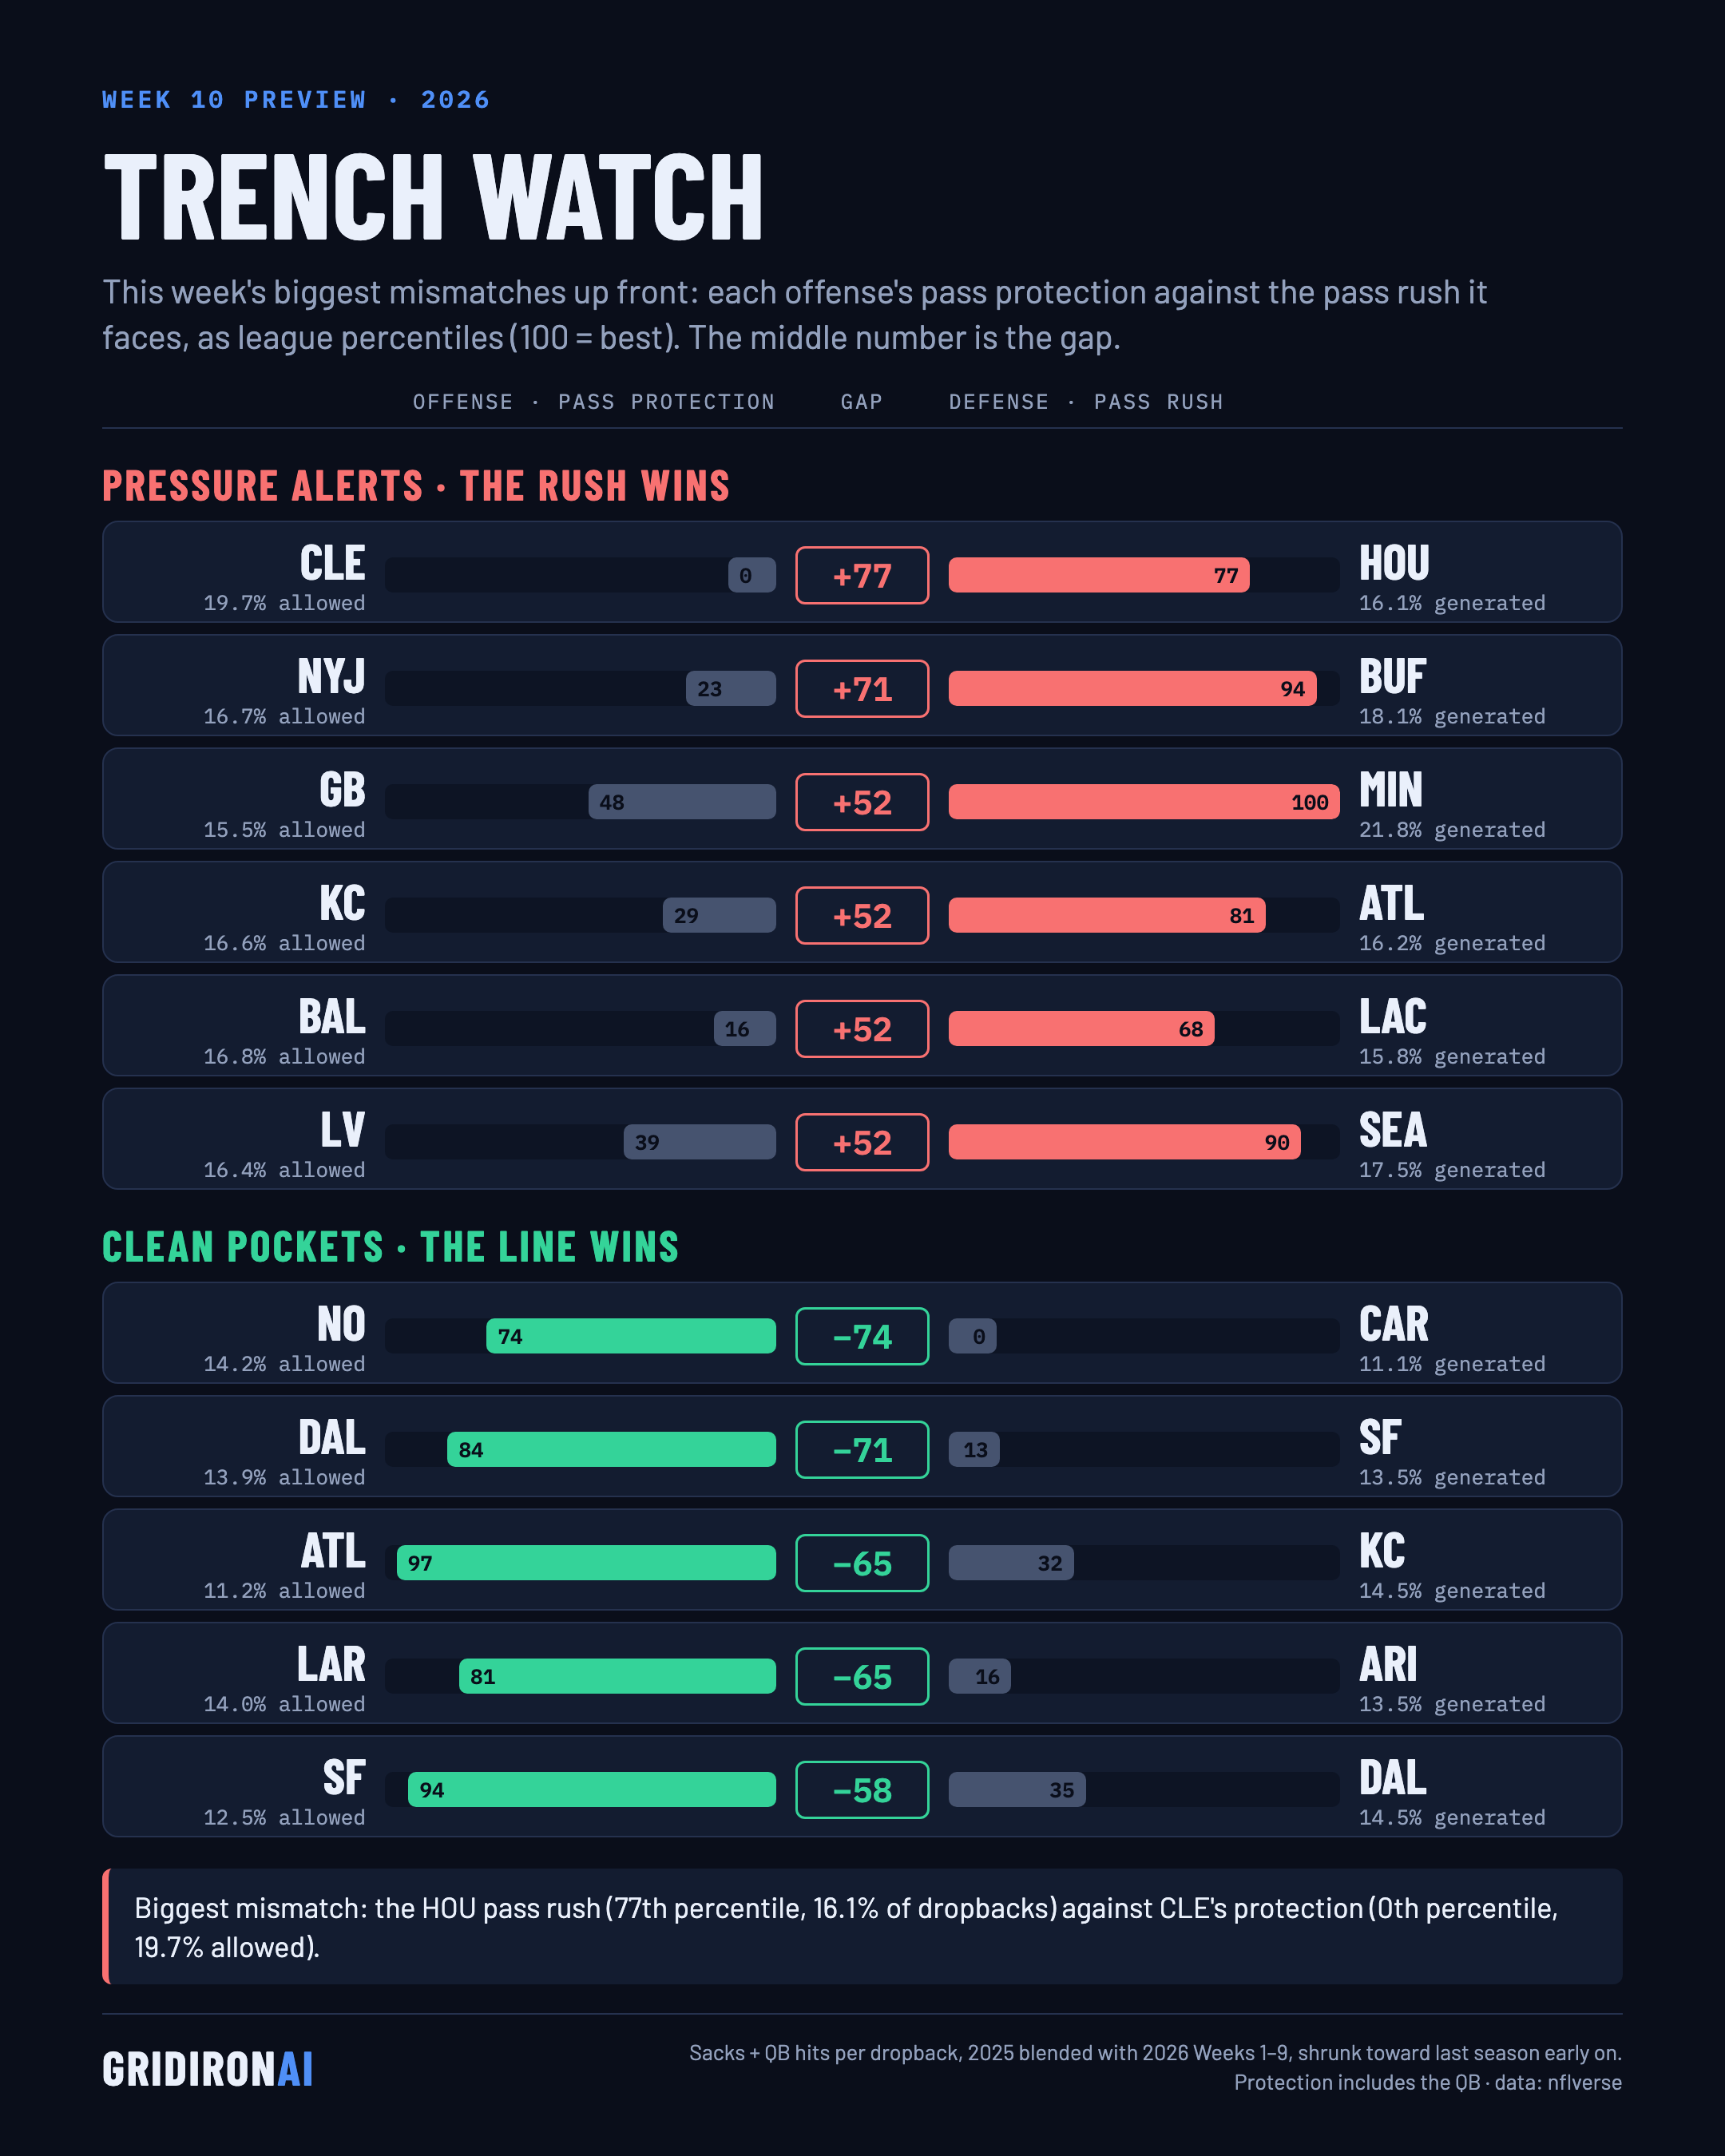
Trench watch, Week 10: the biggest pass-rush mismatches (sacks + QB hits per dropback, league percentile).
HOU rush (77) vs CLE protection (0)
BUF rush (94) vs NYJ protection (23)
LAC rush (68) vs BAL protection (16)
MIN rush (100) vs GB protection (48)
| Defense | Pass rush pctl | Offense | Protection pctl | Gap | |
|---|---|---|---|---|---|
| HOU | 77 | CLE | 0 | +77 | Rush wins |
| BUF | 94 | NYJ | 23 | +71 | Rush wins |
| LAC | 68 | BAL | 16 | +52 | Rush wins |
| MIN | 100 | GB | 48 | +52 | Rush wins |
| ATL | 81 | KC | 29 | +52 | Rush wins |
| SEA | 90 | LV | 39 | +52 | Rush wins |
| BAL | 52 | LAC | 3 | +48 | |
| PIT | 71 | CIN | 26 | +45 | |
| LV | 74 | SEA | 32 | +42 | |
| GB | 48 | MIN | 10 | +39 | |
| DET | 87 | NE | 55 | +32 | |
| NE | 61 | DET | 35 | +26 | |
| MIA | 45 | IND | 19 | +26 | |
| WAS | 29 | NYG | 6 | +23 | |
| CLE | 84 | HOU | 87 | −3 | |
| LA | 10 | ARI | 13 | −3 | |
| NO | 39 | CAR | 52 | −13 | |
| TEN | 55 | JAX | 68 | −13 | |
| JAX | 65 | TEN | 77 | −13 | |
| NYJ | 42 | BUF | 65 | −23 | |
| NYG | 19 | WAS | 42 | −23 | |
| CIN | 26 | PIT | 61 | −35 | |
| IND | 23 | MIA | 58 | −35 | |
| DAL | 35 | SF | 94 | −58 | Line wins |
| ARI | 16 | LA | 81 | −65 | Line wins |
| KC | 32 | ATL | 97 | −65 | Line wins |
| SF | 13 | DAL | 84 | −71 | Line wins |
| CAR | 0 | NO | 74 | −74 | Line wins |
The receipts
Fantasy · Week 9 · Tue, Nov 10
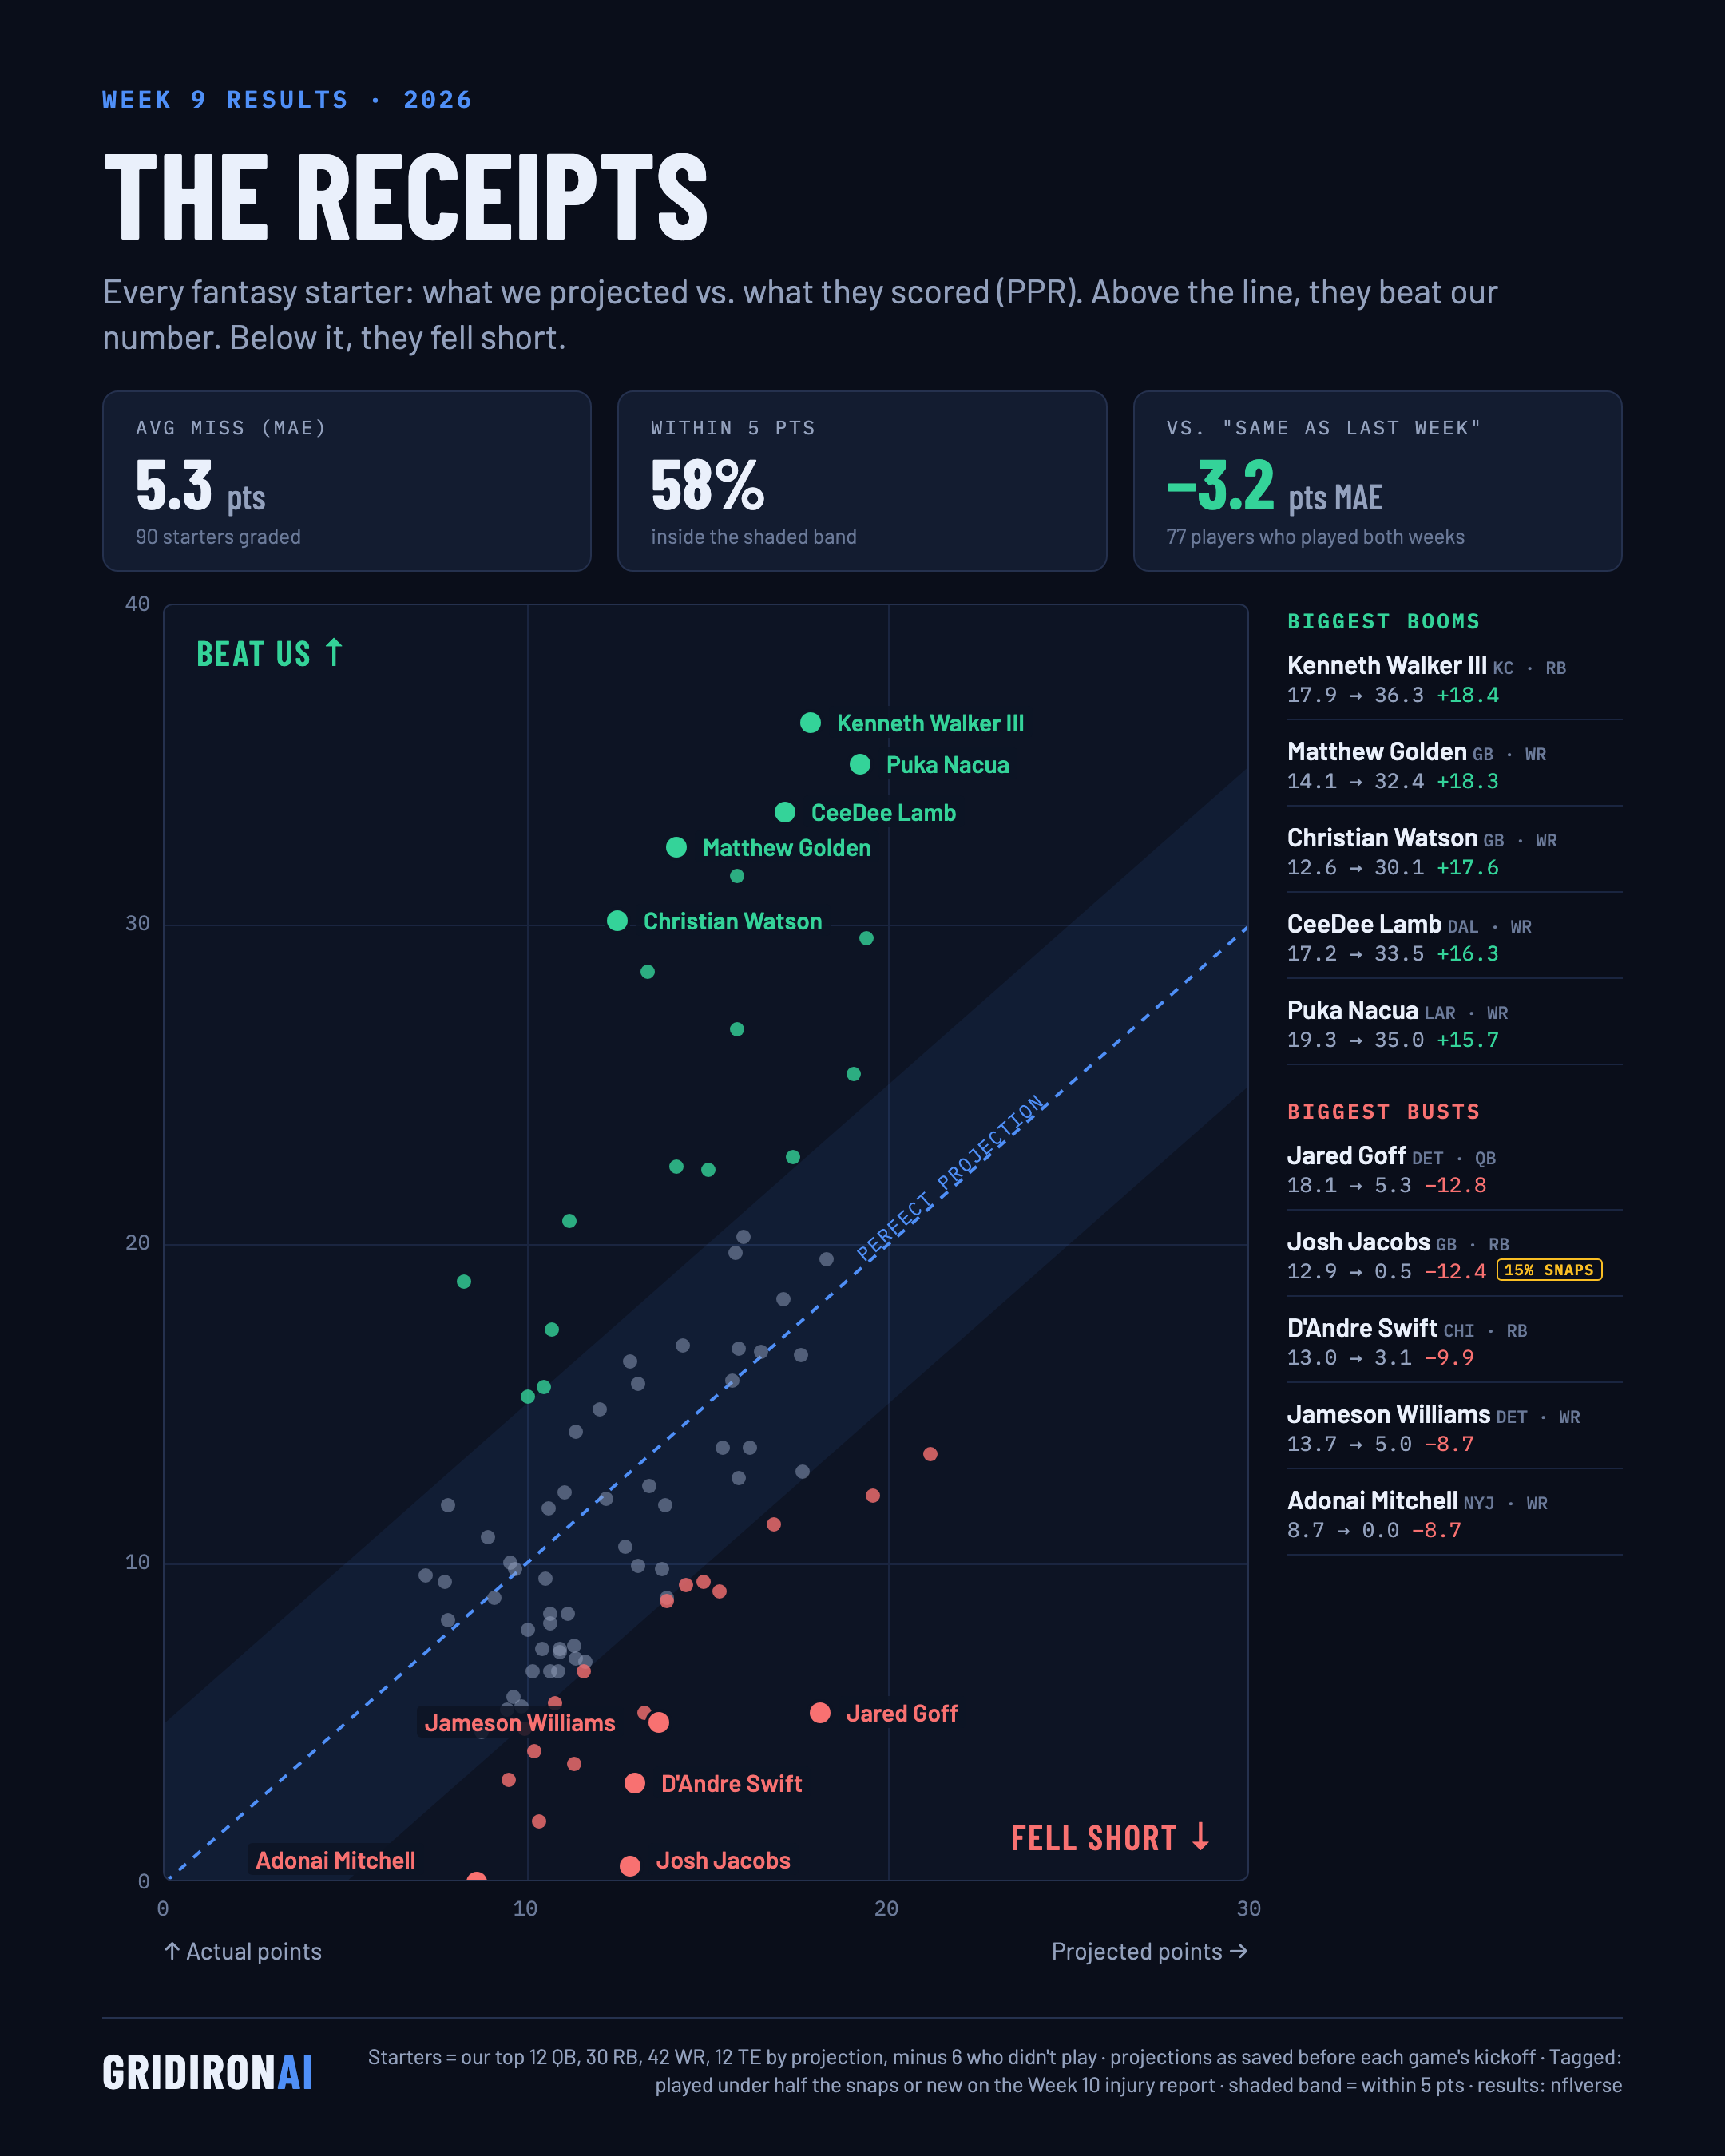
The receipts, Week 9: we projected every fantasy starter; here's how it went.
Average miss: 5.3 pts, 58% within 5.
Biggest boom: Kenneth Walker III, 17.9 projected, 36.3 scored.
Biggest miss: Jared Goff, 18.1 projected, 5.3 scored.
| Player | Pos | Team | Projected | Scored | Diff |
|---|---|---|---|---|---|
| Kenneth Walker III | RB | KC | 17.9 | 36.3 | +18.4 |
| Matthew Golden | WR | GB | 14.1 | 32.4 | +18.3 |
| Christian Watson | WR | GB | 12.6 | 30.1 | +17.6 |
| CeeDee Lamb | WR | DAL | 17.2 | 33.5 | +16.3 |
| Puka Nacua | WR | LA | 19.3 | 35.0 | +15.7 |
| Ja'Marr Chase | WR | CIN | 15.8 | 31.5 | +15.7 |
| Bucky Irving | RB | TB | 13.4 | 28.5 | +15.1 |
| Bijan Robinson | RB | ATL | 15.8 | 26.7 | +10.9 |
| Jonah Coleman | RB | DEN | 8.3 | 18.8 | +10.5 |
| Joe Burrow | QB | CIN | 19.4 | 29.5 | +10.1 |
| Luther Burden | WR | CHI | 11.2 | 20.7 | +9.5 |
| Javonte Williams | RB | DAL | 14.1 | 22.4 | +8.3 |
| Brock Bowers | TE | LV | 15.1 | 22.3 | +7.2 |
| Travis Kelce | TE | KC | 10.7 | 17.3 | +6.6 |
| Brock Purdy | QB | SF | 19.0 | 25.3 | +6.2 |
| Christian McCaffrey | RB | SF | 17.4 | 22.7 | +5.3 |
| DeMario Douglas | WR | NE | 10.1 | 15.2 | +5.1 |
| Nico Collins | WR | HOU | 10.5 | 15.5 | +5.0 |
| Tee Higgins | WR | CIN | 16.0 | 20.2 | +4.2 |
| Jadarian Price | RB | SEA | 7.9 | 11.8 | +3.9 |
| Tyler Shough | QB | NO | 15.8 | 19.7 | +3.9 |
| Isaiah Likely | TE | NYG | 12.9 | 16.3 | +3.4 |
| Rhamondre Stevenson | RB | NE | 12.0 | 14.8 | +2.8 |
| Parker Washington | WR | JAX | 11.4 | 14.1 | +2.7 |
| Tetairoa McMillan | WR | CAR | 13.1 | 15.6 | +2.5 |
| Chris Olave | WR | NO | 14.4 | 16.8 | +2.4 |
| Zach Charbonnet | RB | SEA | 7.3 | 9.6 | +2.3 |
| Xavier Worthy | WR | KC | 9.0 | 10.8 | +1.8 |
| Emmett Johnson | RB | KC | 7.8 | 9.4 | +1.6 |
| Dak Prescott | QB | DAL | 18.3 | 19.5 | +1.2 |
| Drake Maye | QB | NE | 17.1 | 18.3 | +1.2 |
| Harold Fannin | TE | CLE | 11.1 | 12.2 | +1.1 |
| Breece Hall | RB | NYJ | 10.7 | 11.7 | +1.0 |
| James Cook | RB | BUF | 15.9 | 16.7 | +0.8 |
| Dallas Goedert | TE | PHI | 9.6 | 10.0 | +0.4 |
| Saquon Barkley | RB | PHI | 7.8 | 8.2 | +0.4 |
| Khalil Shakir | WR | BUF | 9.7 | 9.8 | +0.1 |
| Amon-Ra St. Brown | WR | DET | 16.5 | 16.6 | +0.1 |
| Bo Nix | QB | DEN | 15.7 | 15.7 | −0.0 |
| Michael Wilson | WR | ARI | 12.2 | 12.0 | −0.2 |
| Rachaad White | RB | WAS | 9.1 | 8.9 | −0.2 |
| Trey McBride | TE | ARI | 13.4 | 12.4 | −1.0 |
| Tre Tucker | WR | LV | 10.5 | 9.5 | −1.0 |
| Patrick Mahomes | QB | KC | 17.6 | 16.5 | −1.1 |
| Chuba Hubbard | RB | CAR | 15.4 | 13.6 | −1.8 |
| Drake London | WR | ATL | 13.9 | 11.8 | −2.1 |
| Alvin Kamara | RB | NO | 10.1 | 7.9 | −2.2 |
| Woody Marks | RB | HOU | 10.7 | 8.4 | −2.3 |
| Chase Brown | RB | CIN | 12.8 | 10.5 | −2.3 |
| Stefon Diggs | WR | WAS | 10.7 | 8.1 | −2.6 |
| Trevor Lawrence | QB | JAX | 16.2 | 13.6 | −2.6 |
| Tyler Warren | TE | IND | 11.1 | 8.4 | −2.7 |
| Ryan Flournoy | WR | DAL | 10.5 | 7.3 | −3.2 |
| Rashee Rice | WR | KC | 13.1 | 9.9 | −3.2 |
| Kirk Cousins | QB | LV | 15.9 | 12.6 | −3.2 |
| Keenan Allen | WR | IND | 10.2 | 6.6 | −3.6 |
| T.J. Hockenson | TE | MIN | 10.9 | 7.3 | −3.6 |
| Sam LaPorta | TE | DET | 11.0 | 7.2 | −3.8 |
| Dalton Kincaid | TE | BUF | 9.7 | 5.8 | −3.9 |
| Ollie Gordon | RB | MIA | 11.3 | 7.4 | −3.9 |
| George Kittle | TE | SF | 13.8 | 9.8 | −4.0 |
| Keon Coleman | WR | BUF | 8.8 | 4.7 | −4.1 |
| Tyler Allgeier | RB | ARI | 10.7 | 6.6 | −4.1 |
| Josh Downs | WR | IND | 9.5 | 5.4 | −4.1 |
| D.J. Moore | WR | BUF | 10.9 | 6.6 | −4.3 |
| Ashton Jeanty | RB | LV | 11.4 | 7.0 | −4.4 |
| Quinshon Judkins | RB | CLE | 9.9 | 5.5 | −4.4 |
| Emeka Egbuka | WR | TB | 11.6 | 6.9 | −4.7 |
| Josh Allen | QB | BUF | 17.7 | 12.9 | −4.8 |
| Bhayshul Tuten | RB | JAX | 13.9 | 8.9 | −5.0 |
| Jalen Coker | WR | CAR | 11.6 | 6.6 | −5.0 |
| Justin Jefferson | WR | MIN | 13.9 | 8.8 | −5.1 |
| Malik Nabers | WR | NYG | 14.4 | 9.3 | −5.1 |
| Jordan Addison | WR | MIN | 9.9 | 4.8 | −5.2 |
| Derrick Henry | RB | BAL | 10.8 | 5.6 | −5.2 |
| Jonathan Taylor | RB | IND | 14.9 | 9.4 | −5.5 |
| Matthew Stafford | QB | LA | 16.8 | 11.2 | −5.6 |
| Malik Washington | WR | MIA | 10.2 | 4.1 | −6.1 |
| Kyren Williams | RB | LA | 15.3 | 9.1 | −6.2 |
| Jaylen Waddle | WR | DEN | 9.5 | 3.2 | −6.3 |
| Jaxon Smith-Njigba | WR | SEA | 19.6 | 12.1 | −7.5 |
| Devaughn Vele | WR | NO | 11.3 | 3.7 | −7.6 |
| Jahmyr Gibbs | RB | DET | 21.2 | 13.4 | −7.8 |
| Zay Flowers | WR | BAL | 13.3 | 5.3 | −8.0 |
| Tucker Kraft | TE | GB | 10.4 | 1.9 | −8.5 |
| Adonai Mitchell | WR | NYJ | 8.7 | 0.0 | −8.7 |
| Jameson Williams | WR | DET | 13.7 | 5.0 | −8.7 |
| D'Andre Swift | RB | CHI | 13.0 | 3.1 | −9.9 |
| Josh Jacobs | RB | GB | 12.9 | 0.5 | −12.4 |
| Jared Goff | QB | DET | 18.1 | 5.3 | −12.8 |
Receiver usage: target share vs. air-yards share
Fantasy · Week 9 · Tue, Nov 10
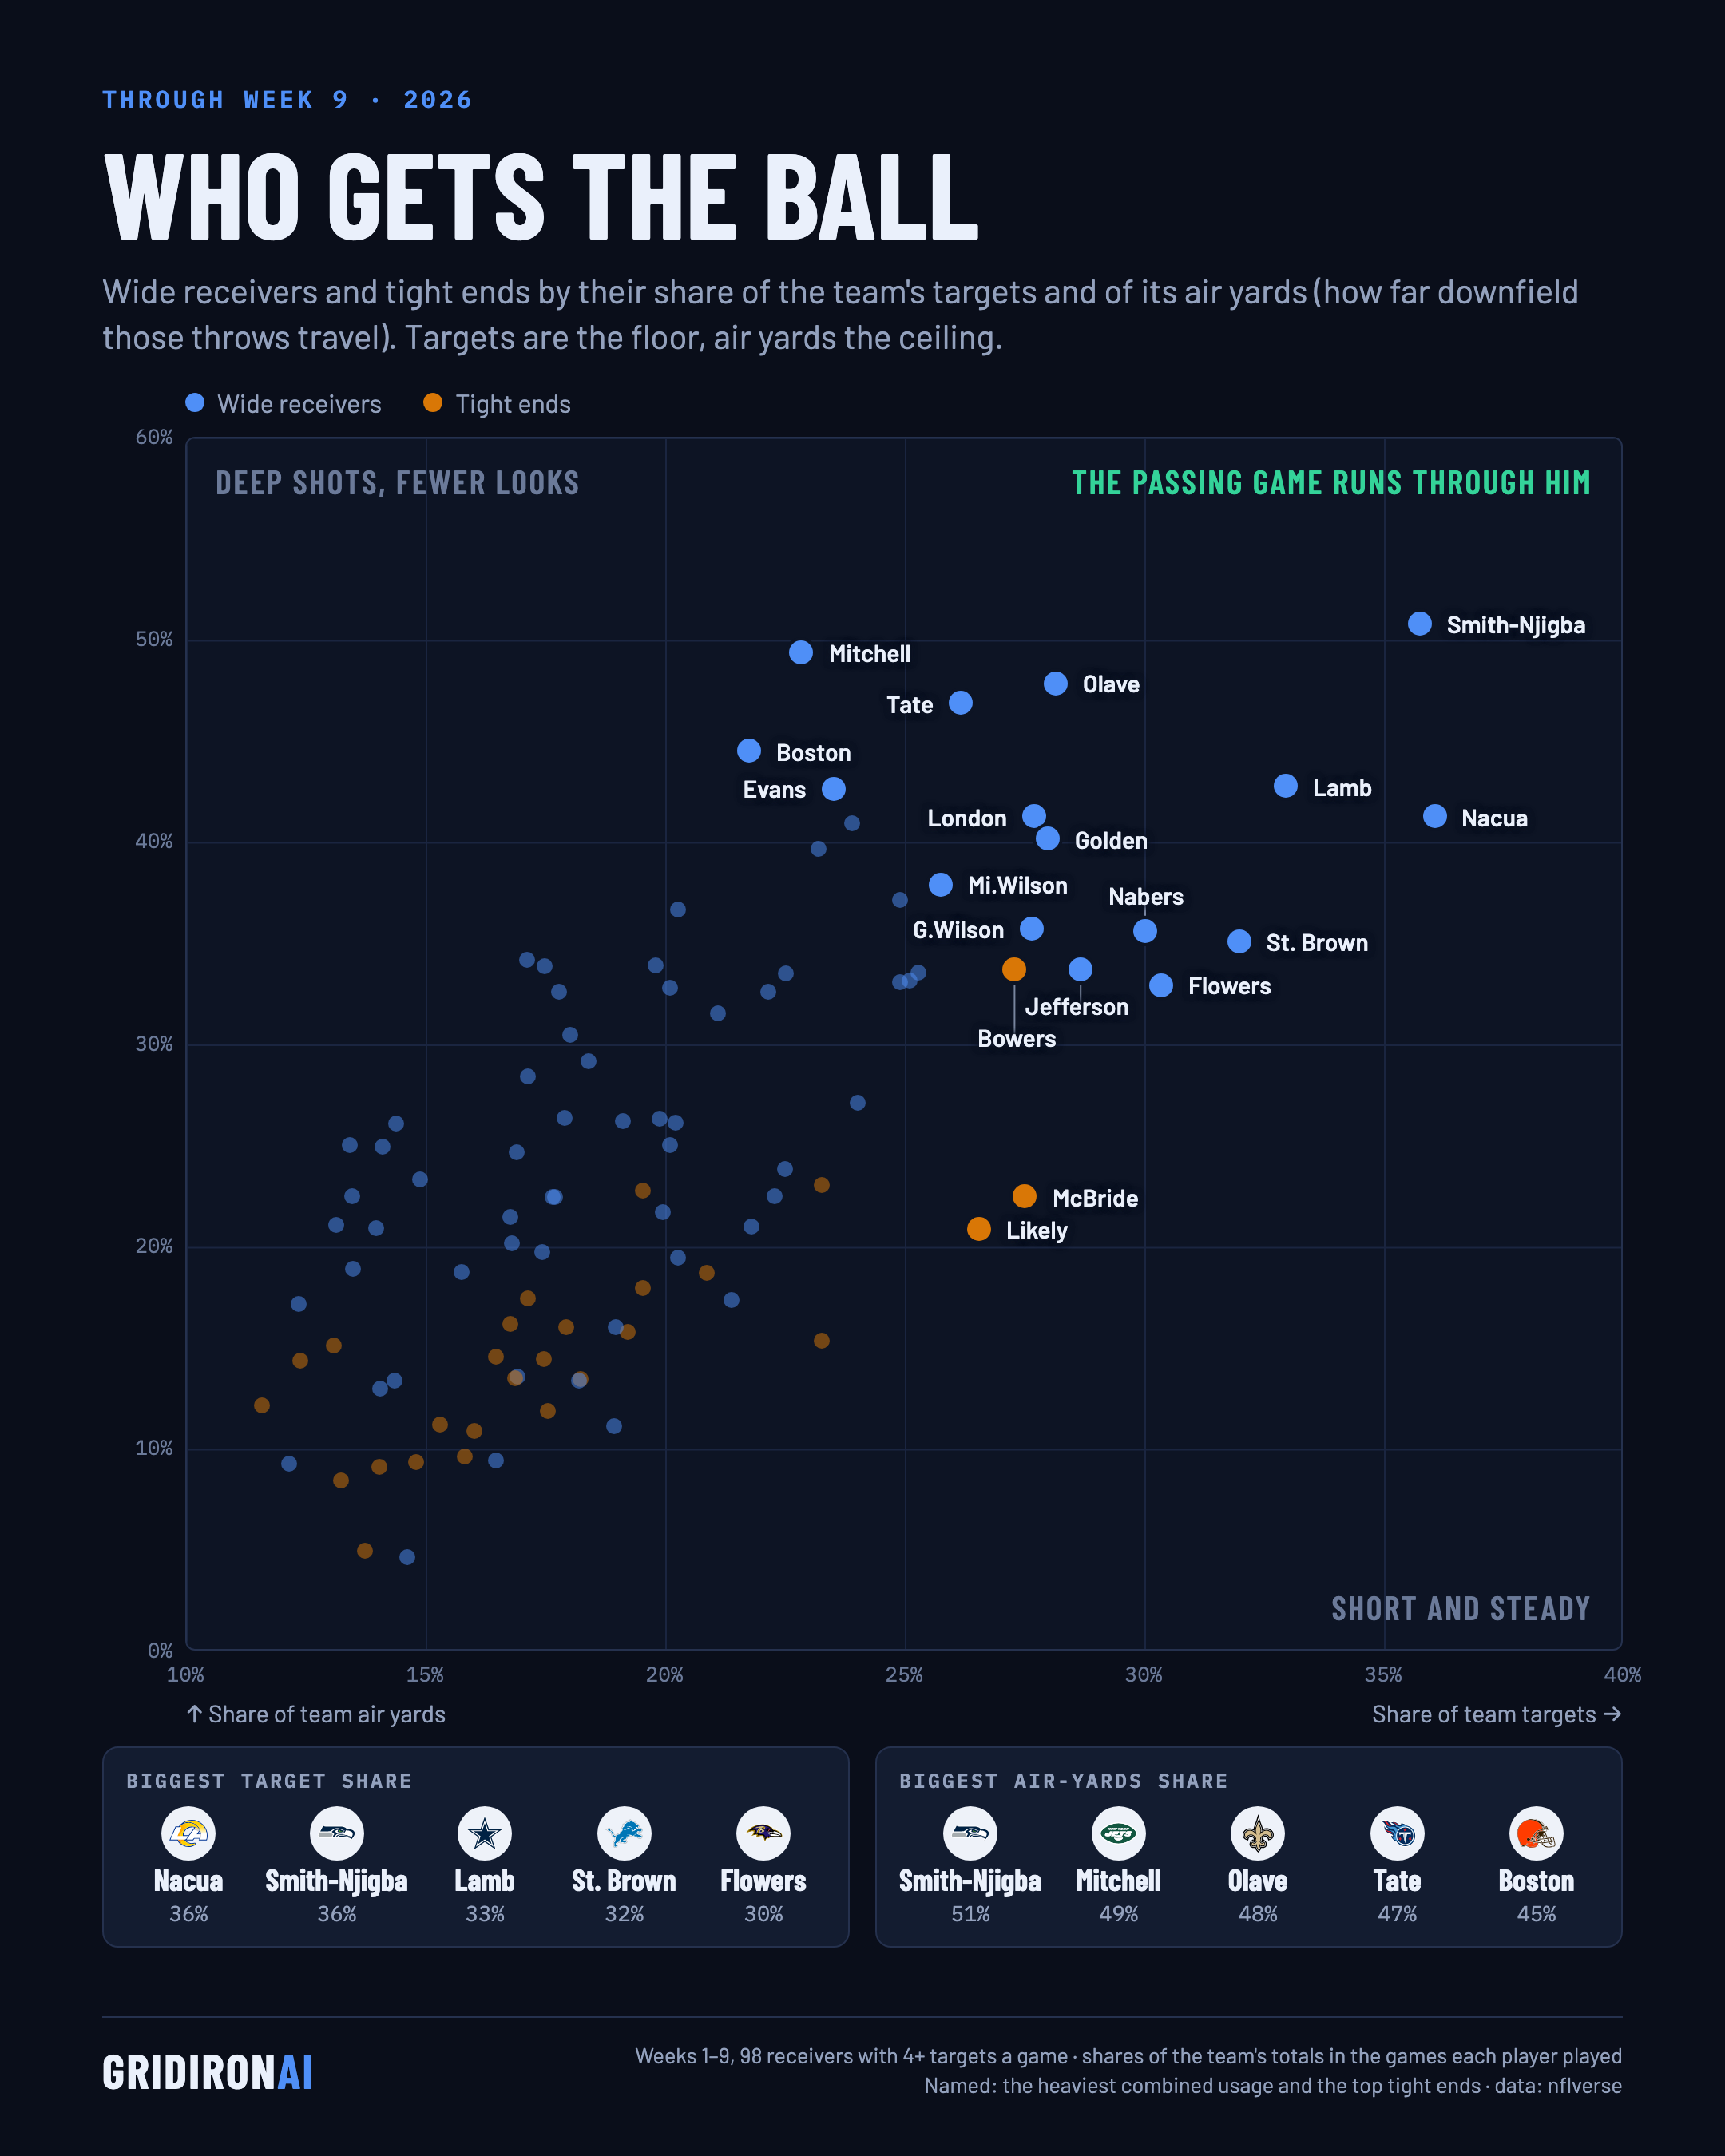
Receiver usage through Week 9: each wide receiver and tight end's share of his team's targets against his share of its air yards (how far downfield the throws to him travel).
Biggest target shares: P.Nacua (LAR, 36%), J.Smith-Njigba (SEA, 36%), C.Lamb (DAL, 33%).
Biggest air-yards shares: J.Smith-Njigba (SEA, 51%), A.Mitchell (NYJ, 49%), C.Olave (NO, 48%).
Shares are of the team's totals in the games each player played. 98 receivers with at least 4 targets a game.
| Player | Pos | Team | Targets | Target share | Air yards | Air-yards share | Avg depth |
|---|---|---|---|---|---|---|---|
| J.Smith-Njigba | WR | SEA | 99 | 36% | 998 | 51% | 10.1 |
| P.Nacua | WR | LAR | 93 | 36% | 740 | 41% | 8.0 |
| C.Lamb | WR | DAL | 108 | 33% | 1157 | 43% | 10.7 |
| C.Olave | WR | NO | 83 | 28% | 1100 | 48% | 13.3 |
| A.St. Brown | WR | DET | 86 | 32% | 722 | 35% | 8.4 |
| C.Tate | WR | TEN | 51 | 26% | 646 | 47% | 12.7 |
| D.London | WR | ATL | 67 | 28% | 657 | 41% | 9.8 |
| M.Golden | WR | GB | 92 | 28% | 1285 | 40% | 14.0 |
| M.Nabers | WR | NYG | 78 | 30% | 893 | 36% | 11.4 |
| A.Mitchell | WR | NYJ | 34 | 23% | 600 | 49% | 17.6 |
| Z.Flowers | WR | BAL | 64 | 30% | 487 | 33% | 7.6 |
| J.Jefferson | WR | MIN | 51 | 29% | 536 | 34% | 10.5 |
| G.Wilson | WR | NYJ | 63 | 28% | 653 | 36% | 10.4 |
| Mi.Wilson | WR | ARI | 88 | 26% | 947 | 38% | 10.8 |
| M.Evans | WR | SF | 39 | 23% | 571 | 43% | 14.6 |
| B.Bowers | TE | LV | 69 | 27% | 681 | 34% | 9.9 |
| D.Metcalf | WR | PIT | 64 | 24% | 809 | 41% | 12.6 |
| D.Boston | WR | CLE | 60 | 22% | 871 | 45% | 14.5 |
| P.Washington | WR | JAX | 55 | 25% | 679 | 37% | 12.3 |
| T.Higgins | WR | CIN | 67 | 23% | 873 | 40% | 13.0 |
| J.Chase | WR | CIN | 73 | 25% | 738 | 34% | 10.1 |
| T.McMillan | WR | CAR | 71 | 25% | 782 | 33% | 11.0 |
| E.Egbuka | WR | TB | 54 | 25% | 543 | 33% | 10.1 |
| C.Watson | WR | GB | 74 | 22% | 1072 | 34% | 14.5 |
| T.McBride | TE | ARI | 94 | 27% | 562 | 23% | 6.0 |
| D.Adams | WR | LAR | 49 | 20% | 759 | 37% | 15.5 |
| C.Douglas | WR | MIA | 27 | 22% | 331 | 33% | 12.3 |
| M.Washington | WR | MIA | 48 | 24% | 506 | 27% | 10.5 |
| I.Likely | TE | NYG | 69 | 27% | 524 | 21% | 7.6 |
| G.Pickens | WR | DAL | 62 | 21% | 722 | 32% | 11.6 |
| J.Addison | WR | MIN | 36 | 20% | 536 | 34% | 14.9 |
| J.Waddle | WR | DEN | 52 | 20% | 520 | 33% | 10.0 |
| G.Kittle | TE | SF | 53 | 23% | 434 | 23% | 8.2 |
| K.Allen | WR | IND | 58 | 22% | 464 | 24% | 8.0 |
| R.Odunze | WR | CHI | 51 | 17% | 747 | 34% | 14.6 |
| J.Williams | WR | DET | 46 | 17% | 703 | 34% | 15.3 |
| C.Sutton | WR | DEN | 46 | 18% | 517 | 33% | 11.2 |
| L.Burden | WR | CHI | 65 | 22% | 496 | 23% | 7.6 |
| N.Collins | WR | HOU | 39 | 20% | 469 | 26% | 12.0 |
| T.Tucker | WR | LV | 56 | 18% | 771 | 30% | 13.8 |
| J.Downs | WR | IND | 57 | 20% | 547 | 26% | 9.6 |
| D.Moore | WR | BUF | 32 | 18% | 502 | 29% | 15.7 |
| J.Coker | WR | CAR | 49 | 20% | 512 | 25% | 10.4 |
| S.Diggs | WR | WAS | 49 | 22% | 436 | 21% | 8.9 |
| X.Worthy | WR | KC | 47 | 19% | 370 | 26% | 7.9 |
| T.Warren | TE | IND | 53 | 23% | 246 | 15% | 4.6 |
| D.Wicks | WR | PHI | 32 | 17% | 420 | 28% | 13.1 |
| T.McLaurin | WR | WAS | 27 | 18% | 347 | 26% | 12.9 |
| T.Kelce | TE | KC | 48 | 20% | 322 | 23% | 6.7 |
| K.Concepcion | WR | CLE | 55 | 20% | 425 | 22% | 7.7 |
| T.Hockenson | TE | MIN | 44 | 21% | 328 | 19% | 7.5 |
| W.Robinson | WR | TEN | 50 | 21% | 288 | 17% | 5.8 |
| R.Rice | WR | KC | 32 | 20% | 158 | 19% | 4.9 |
| M.Hollins | WR | NE | 26 | 17% | 381 | 25% | 14.7 |
| T.Harris | WR | LAC | 35 | 18% | 376 | 22% | 10.7 |
| D.Vele | WR | NO | 52 | 18% | 517 | 23% | 9.9 |
| C.Loveland | TE | CHI | 57 | 20% | 396 | 18% | 6.9 |
| J.Meyers | WR | JAX | 37 | 17% | 393 | 22% | 10.6 |
| D.Douglas | WR | NE | 46 | 17% | 502 | 20% | 10.9 |
| H.Fannin | TE | CLE | 53 | 19% | 309 | 16% | 5.8 |
| R.Wilson | WR | PIT | 25 | 14% | 381 | 26% | 15.2 |
| M.Lemon | WR | PHI | 54 | 19% | 341 | 16% | 6.3 |
| X.Hutchinson | WR | HOU | 45 | 17% | 511 | 20% | 11.4 |
| K.Coleman | WR | BUF | 33 | 15% | 477 | 23% | 14.5 |
| Q.Johnston | WR | LAC | 30 | 14% | 429 | 25% | 14.3 |
| M.Andrews | TE | BAL | 43 | 18% | 287 | 16% | 6.7 |
| D.Kincaid | TE | BUF | 38 | 17% | 357 | 17% | 9.4 |
| R.Doubs | WR | NE | 24 | 13% | 423 | 25% | 17.6 |
| S.LaPorta | TE | DET | 49 | 18% | 277 | 13% | 5.7 |
| A.Williams | WR | WAS | 39 | 16% | 425 | 19% | 10.9 |
| G.Bernard | WR | PIT | 42 | 18% | 213 | 13% | 5.1 |
| B.Strange | TE | JAX | 37 | 17% | 296 | 16% | 8.0 |
| D.Goedert | TE | PHI | 41 | 17% | 255 | 14% | 6.2 |
| K.Shakir | WR | BUF | 42 | 19% | 228 | 11% | 5.4 |
| D.Cooper | WR | PHI | 32 | 13% | 394 | 23% | 12.3 |
| R.Shaheed | WR | SEA | 30 | 14% | 333 | 21% | 11.1 |
| O.Cooper | WR | NYJ | 24 | 17% | 165 | 14% | 6.9 |
| C.Otton | TE | TB | 38 | 16% | 249 | 15% | 6.6 |
| C.Okonkwo | TE | WAS | 31 | 17% | 225 | 14% | 7.3 |
| D.Schultz | TE | HOU | 47 | 18% | 301 | 12% | 6.4 |
| L.McConkey | WR | LAC | 24 | 13% | 298 | 21% | 12.4 |
| M.Fields | WR | NYG | 35 | 13% | 474 | 19% | 13.5 |
| G.Dulcich | TE | MIA | 32 | 16% | 204 | 11% | 6.4 |
| C.Godwin | WR | TB | 38 | 16% | 162 | 9% | 4.3 |
| R.Flournoy | WR | DAL | 47 | 14% | 363 | 13% | 7.7 |
| K.Pitts | TE | ATL | 37 | 15% | 179 | 11% | 4.8 |
| J.Nailor | WR | LV | 28 | 12% | 322 | 17% | 11.5 |
| T.Kraft | TE | GB | 52 | 16% | 309 | 10% | 5.9 |
| P.Freiermuth | TE | PIT | 35 | 13% | 299 | 15% | 8.5 |
| K.Raymond | WR | CHI | 41 | 14% | 287 | 13% | 7.0 |
| M.Mayer | TE | LV | 46 | 15% | 237 | 9% | 5.2 |
| D.Waller | TE | CAR | 35 | 12% | 339 | 14% | 9.7 |
| H.Henry | TE | NE | 37 | 14% | 232 | 9% | 6.3 |
| T.Higbee | TE | LAR | 39 | 12% | 322 | 12% | 8.3 |
| J.Johnson | TE | NO | 39 | 13% | 195 | 8% | 5.0 |
| D.Samuel | WR | SF | 20 | 15% | 51 | 5% | 2.5 |
| K.Bourne | WR | ARI | 38 | 12% | 215 | 9% | 5.7 |
| A.Barner | TE | SEA | 38 | 14% | 98 | 5% | 2.6 |
Workload vs. points: expected fantasy points vs. actual
Fantasy · Week 9 · Tue, Nov 10
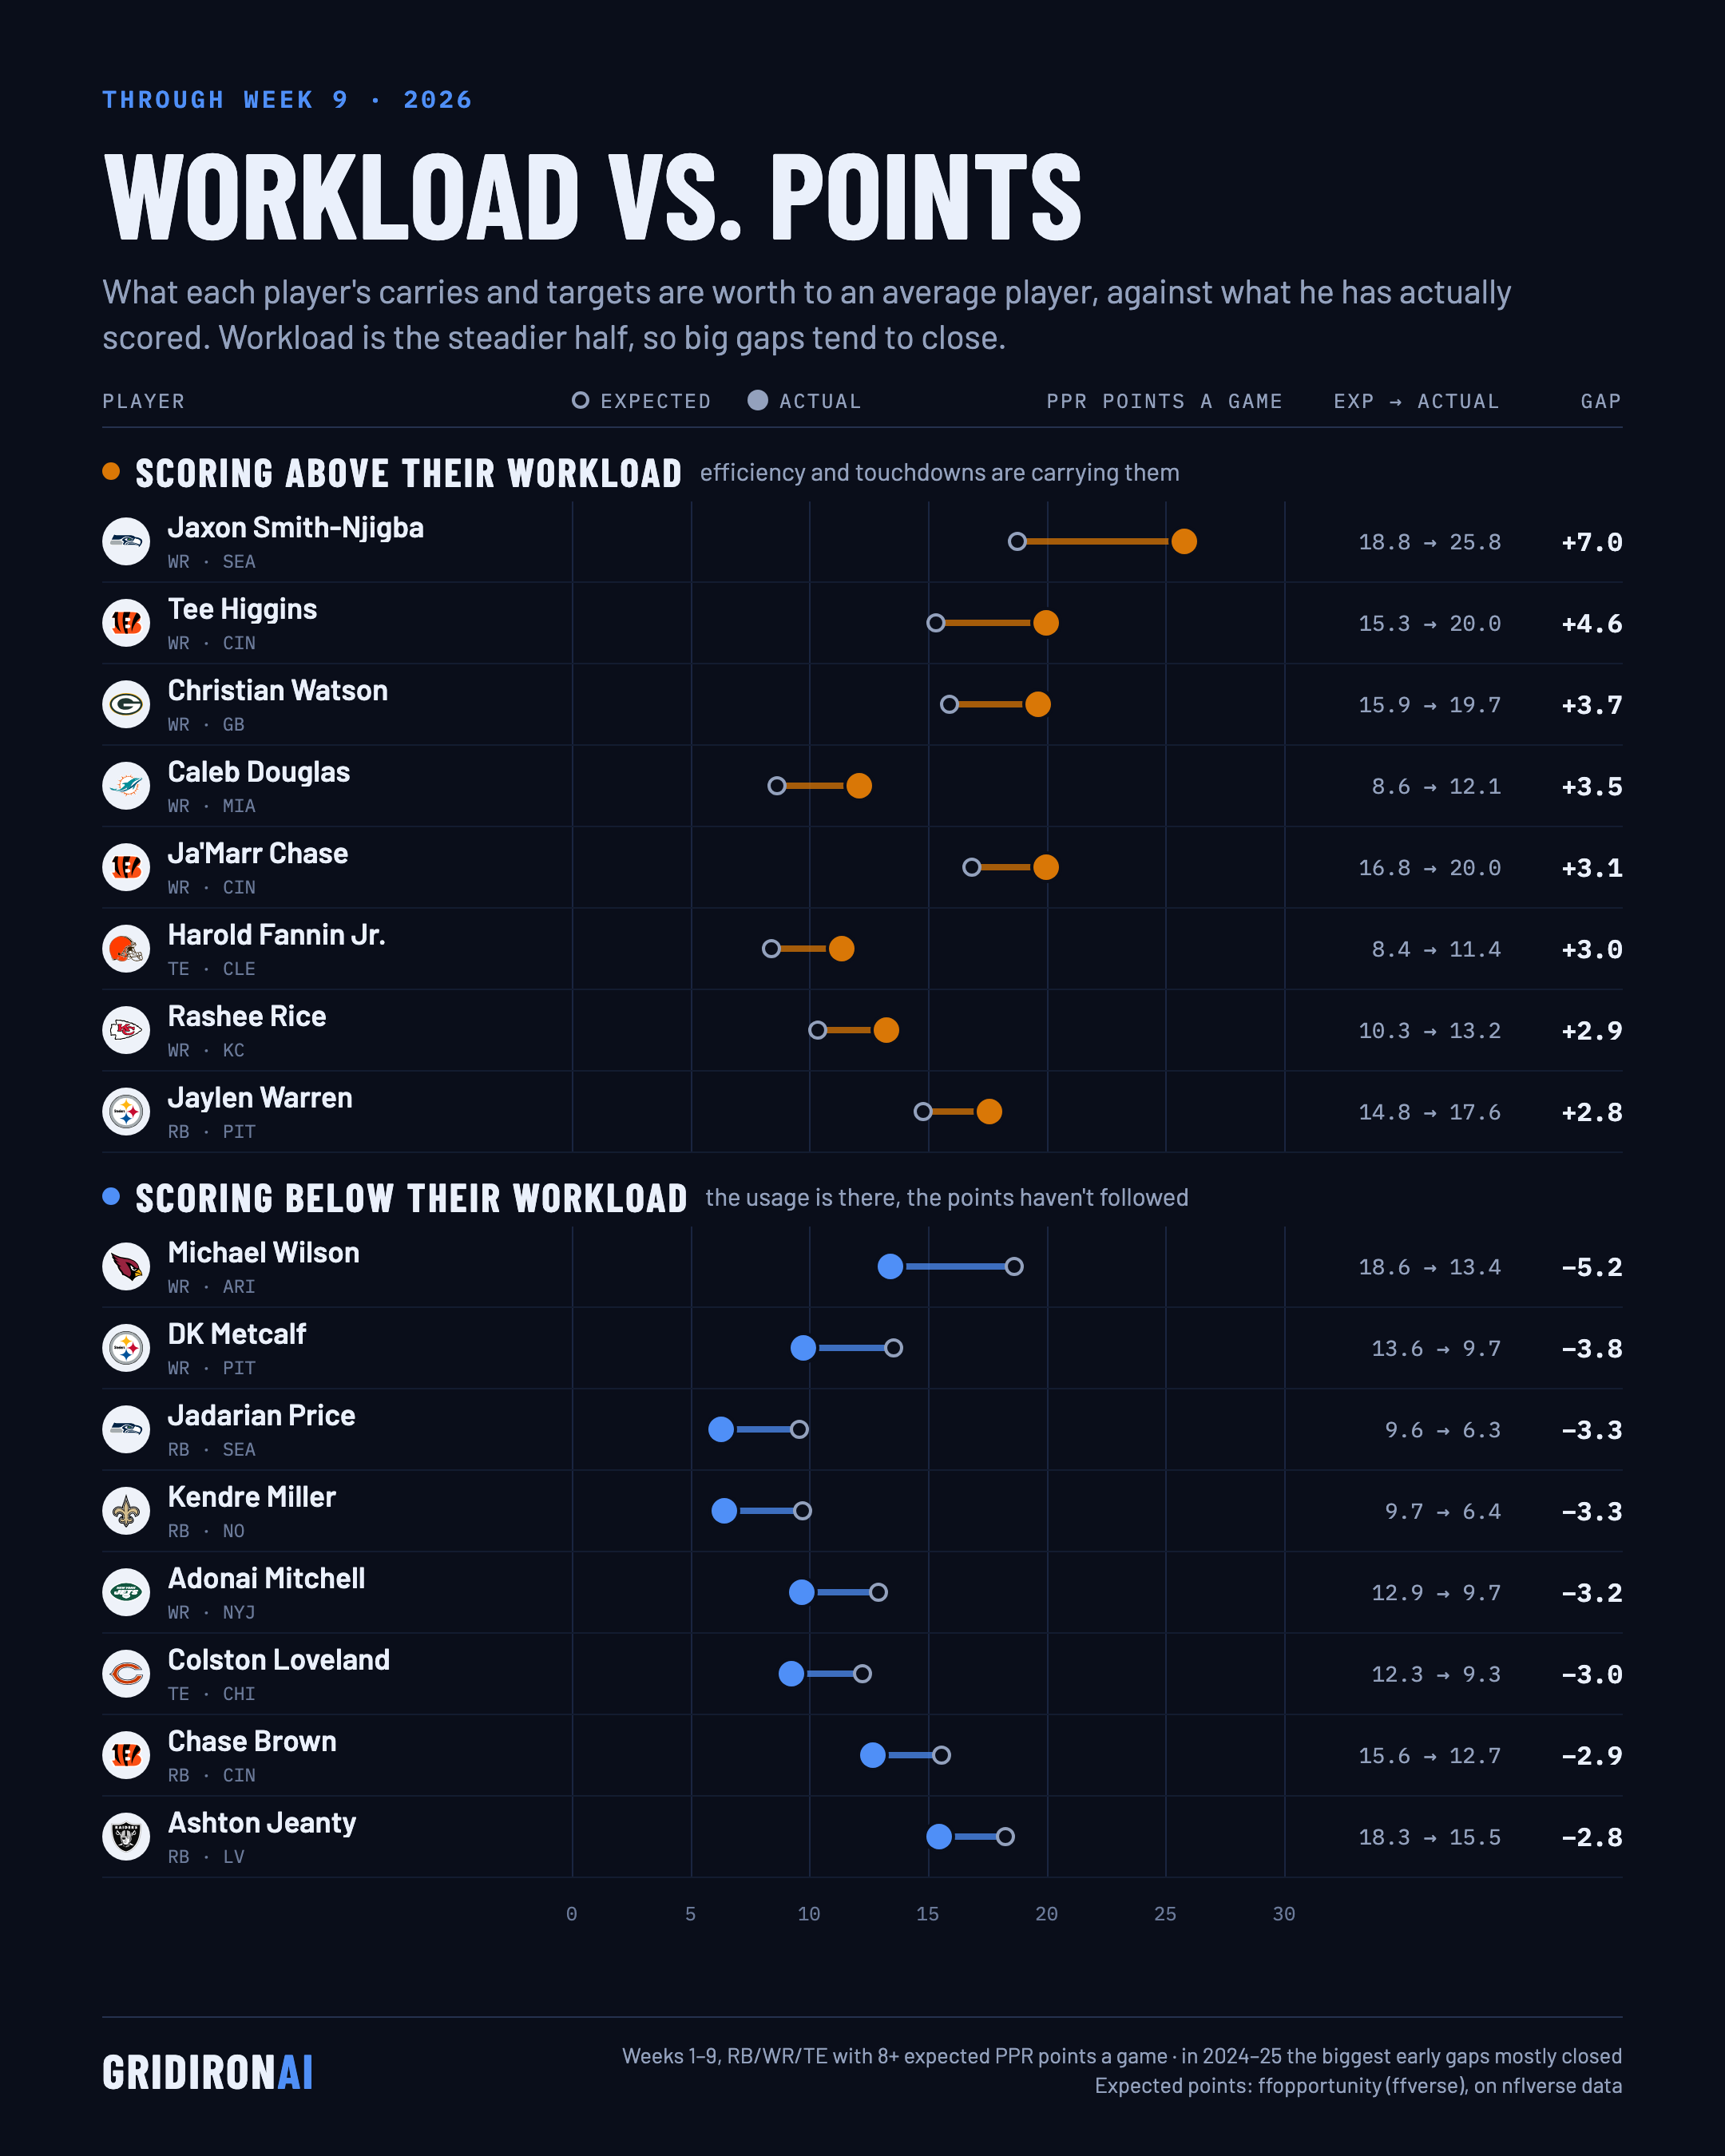
Workload vs. points through Week 9: expected PPR points per game (what an average player scores on the same carries and targets) against what each player has actually scored.
Furthest above their workload: Jaxon Smith-Njigba (+7.0), Tee Higgins (+4.6), Christian Watson (+3.7) points a game.
Furthest below: Michael Wilson (−5.2), DK Metcalf (−3.8), Jadarian Price (−3.3).
Workload is the steadier half, so big gaps tend to close: in 2024 and 2025 the players furthest above theirs after four weeks kept under a third of the gap the rest of the way, and the ones furthest below got back to even. A tendency across players, not a forecast for any one of them.
120 running backs, wide receivers and tight ends with at least 8 expected points a game.
| Player | Pos | Team | Games | Expected pts/game | Actual pts/game | Gap |
|---|---|---|---|---|---|---|
| Jaxon Smith-Njigba | WR | SEA | 9 | 18.8 | 25.8 | +7.0 |
| Tee Higgins | WR | CIN | 8 | 15.3 | 20.0 | +4.6 |
| Christian Watson | WR | GB | 9 | 15.9 | 19.7 | +3.7 |
| Caleb Douglas | WR | MIA | 5 | 8.6 | 12.1 | +3.5 |
| Ja'Marr Chase | WR | CIN | 8 | 16.8 | 20.0 | +3.1 |
| Harold Fannin Jr. | TE | CLE | 9 | 8.4 | 11.4 | +3.0 |
| Rashee Rice | WR | KC | 5 | 10.3 | 13.2 | +2.9 |
| Jaylen Warren | RB | PIT | 8 | 14.8 | 17.6 | +2.8 |
| Zay Flowers | WR | BAL | 8 | 13.2 | 15.9 | +2.8 |
| Bhayshul Tuten | RB | JAX | 8 | 13.2 | 15.9 | +2.7 |
| Nico Collins | WR | HOU | 6 | 12.7 | 15.3 | +2.6 |
| Mike Evans | WR | SF | 6 | 13.3 | 15.8 | +2.6 |
| James Cook | RB | BUF | 8 | 16.2 | 18.6 | +2.3 |
| Travis Kelce | TE | KC | 8 | 10.2 | 12.4 | +2.2 |
| DeMario Douglas | WR | NE | 9 | 8.5 | 10.7 | +2.2 |
| Brock Bowers | TE | LV | 7 | 18.8 | 20.9 | +2.1 |
| Dallas Goedert | TE | PHI | 7 | 8.7 | 10.6 | +1.9 |
| Bijan Robinson | RB | ATL | 9 | 18.0 | 19.8 | +1.9 |
| Chuba Hubbard | RB | CAR | 8 | 16.5 | 18.3 | +1.9 |
| Blake Corum | RB | LAR | 9 | 8.6 | 10.5 | +1.9 |
| Kenneth Walker III | RB | KC | 8 | 22.7 | 24.6 | +1.9 |
| Davante Adams | WR | LAR | 6 | 15.2 | 17.0 | +1.8 |
| Bucky Irving | RB | TB | 9 | 15.9 | 17.7 | +1.8 |
| Isaiah Likely | TE | NYG | 8 | 14.4 | 16.1 | +1.7 |
| Romeo Doubs | WR | NE | 6 | 8.0 | 9.7 | +1.7 |
| Stefon Diggs | WR | WAS | 7 | 11.3 | 12.9 | +1.6 |
| RJ Harvey | RB | DEN | 6 | 9.6 | 11.2 | +1.6 |
| Juwan Johnson | TE | NO | 8 | 8.3 | 9.9 | +1.5 |
| Pat Freiermuth | TE | PIT | 8 | 8.5 | 9.9 | +1.4 |
| Dalton Kincaid | TE | BUF | 8 | 9.2 | 10.6 | +1.4 |
| Rhamondre Stevenson | RB | NE | 9 | 11.3 | 12.6 | +1.3 |
| Luther Burden III | WR | CHI | 9 | 13.9 | 15.1 | +1.3 |
| Parker Washington | WR | JAX | 8 | 12.5 | 13.7 | +1.2 |
| Tre Tucker | WR | LV | 9 | 11.0 | 12.1 | +1.1 |
| T.J. Hockenson | TE | MIN | 8 | 9.6 | 10.7 | +1.1 |
| Brenton Strange | TE | JAX | 8 | 8.1 | 9.0 | +0.8 |
| Germie Bernard | WR | PIT | 7 | 8.8 | 9.5 | +0.8 |
| Jameson Williams | WR | DET | 8 | 12.5 | 13.2 | +0.7 |
| Wan'Dale Robinson | WR | TEN | 8 | 9.0 | 9.7 | +0.7 |
| Alvin Kamara | RB | NO | 7 | 9.9 | 10.5 | +0.7 |
| Rachaad White | RB | WAS | 7 | 9.6 | 10.2 | +0.6 |
| Braelon Allen | RB | NYJ | 9 | 11.0 | 11.7 | +0.6 |
| Justin Jefferson | WR | MIN | 7 | 13.0 | 13.6 | +0.6 |
| Puka Nacua | WR | LAR | 7 | 24.2 | 24.8 | +0.6 |
| Tyler Allgeier | RB | ARI | 9 | 9.5 | 10.1 | +0.6 |
| Jakobi Meyers | WR | JAX | 8 | 8.9 | 9.4 | +0.5 |
| George Kittle | TE | SF | 8 | 13.7 | 14.3 | +0.5 |
| Garrett Wilson | WR | NYJ | 8 | 13.8 | 14.2 | +0.4 |
| Michael Mayer | TE | LV | 9 | 8.7 | 9.1 | +0.4 |
| Mack Hollins | WR | NE | 5 | 9.4 | 9.7 | +0.3 |
| Trey McBride | TE | ARI | 9 | 17.8 | 18.1 | +0.3 |
| Deebo Samuel Sr. | WR | SF | 5 | 9.0 | 9.3 | +0.3 |
| Keon Coleman | WR | BUF | 8 | 8.7 | 8.9 | +0.2 |
| Jalen Coker | WR | CAR | 7 | 12.4 | 12.6 | +0.2 |
| Tony Pollard | RB | TEN | 8 | 14.4 | 14.6 | +0.2 |
| Jahmyr Gibbs | RB | DET | 8 | 25.9 | 26.0 | +0.1 |
| KC Concepcion | WR | CLE | 9 | 9.7 | 9.8 | +0.1 |
| Cam Skattebo | RB | NYG | 6 | 11.6 | 11.7 | +0.1 |
| Denzel Boston | WR | CLE | 9 | 11.3 | 11.4 | +0.1 |
| Kyren Williams | RB | LAR | 9 | 17.6 | 17.7 | +0.1 |
| Jacory Croskey-Merritt | RB | WAS | 5 | 8.9 | 9.0 | +0.1 |
| Dontayvion Wicks | WR | PHI | 6 | 8.9 | 8.9 | 0.0 |
| Carnell Tate | WR | TEN | 7 | 11.1 | 11.0 | −0.1 |
| Drake London | WR | ATL | 9 | 13.6 | 13.5 | −0.1 |
| Christian McCaffrey | RB | SF | 8 | 21.0 | 20.8 | −0.1 |
| Chris Olave | WR | NO | 8 | 17.8 | 17.7 | −0.2 |
| Dalton Schultz | TE | HOU | 8 | 9.2 | 8.9 | −0.2 |
| David Montgomery | RB | HOU | 5 | 9.0 | 8.7 | −0.3 |
| Malik Nabers | WR | NYG | 8 | 16.5 | 16.2 | −0.3 |
| CeeDee Lamb | WR | DAL | 9 | 22.7 | 22.4 | −0.3 |
| Sam LaPorta | TE | DET | 8 | 11.9 | 11.6 | −0.3 |
| Devaughn Vele | WR | NO | 8 | 11.5 | 11.2 | −0.3 |
| Ryan Flournoy | WR | DAL | 9 | 9.7 | 9.3 | −0.4 |
| Makai Lemon | WR | PHI | 9 | 8.6 | 8.2 | −0.4 |
| Khalil Shakir | WR | BUF | 8 | 9.9 | 9.3 | −0.5 |
| Tyler Warren | TE | IND | 7 | 12.6 | 12.0 | −0.6 |
| Javonte Williams | RB | DAL | 9 | 18.4 | 17.7 | −0.6 |
| Tucker Kraft | TE | GB | 9 | 10.7 | 10.0 | −0.7 |
| Terry McLaurin | WR | WAS | 5 | 10.0 | 9.2 | −0.8 |
| Derrick Henry | RB | BAL | 9 | 16.6 | 15.8 | −0.8 |
| Aaron Jones | RB | MIN | 8 | 11.2 | 10.4 | −0.8 |
| Saquon Barkley | RB | PHI | 7 | 9.3 | 8.4 | −0.9 |
| Jaylen Waddle | WR | DEN | 9 | 10.0 | 9.1 | −0.9 |
| Malik Washington | WR | MIA | 8 | 10.4 | 9.5 | −0.9 |
| Tetairoa McMillan | WR | CAR | 8 | 16.2 | 15.3 | −0.9 |
| Rico Dowdle | RB | PIT | 5 | 9.9 | 8.9 | −0.9 |
| Jonathan Taylor | RB | IND | 9 | 18.0 | 17.1 | −1.0 |
| Chig Okonkwo | TE | WAS | 6 | 8.2 | 7.1 | −1.1 |
| AJ Barner | TE | SEA | 9 | 8.1 | 7.0 | −1.1 |
| George Pickens | WR | DAL | 8 | 14.1 | 13.0 | −1.1 |
| Jordan Addison | WR | MIN | 7 | 9.0 | 7.7 | −1.3 |
| DJ Moore | WR | BUF | 6 | 11.2 | 9.9 | −1.3 |
| Rome Odunze | WR | CHI | 9 | 11.2 | 9.9 | −1.3 |
| Tre Harris | WR | LAC | 7 | 8.2 | 6.7 | −1.4 |
| Amon-Ra St. Brown | WR | DET | 8 | 21.2 | 19.7 | −1.5 |
| Keenan Allen | WR | IND | 8 | 11.6 | 10.1 | −1.5 |
| MarShawn Lloyd | RB | GB | 8 | 8.0 | 6.4 | −1.6 |
| Ollie Gordon II | RB | MIA | 7 | 13.0 | 11.4 | −1.6 |
| Omarion Hampton | RB | LAC | 8 | 10.2 | 8.5 | −1.7 |
| Quinshon Judkins | RB | CLE | 8 | 13.2 | 11.5 | −1.7 |
| Emanuel Wilson | RB | SEA | 7 | 12.4 | 10.7 | −1.7 |
| Xavier Hutchinson | WR | HOU | 8 | 10.0 | 8.3 | −1.7 |
| D'Andre Swift | RB | CHI | 9 | 18.9 | 17.1 | −1.9 |
| Matthew Golden | WR | GB | 9 | 20.1 | 18.2 | −1.9 |
| Josh Downs | WR | IND | 9 | 10.3 | 8.3 | −1.9 |
| Xavier Worthy | WR | KC | 8 | 10.3 | 8.3 | −2.0 |
| Mark Andrews | TE | BAL | 9 | 8.5 | 6.5 | −2.0 |
| Jeremiyah Love | RB | ARI | 6 | 11.0 | 8.9 | −2.1 |
| J.K. Dobbins | RB | DEN | 9 | 9.1 | 6.9 | −2.1 |
| Woody Marks | RB | HOU | 8 | 11.1 | 8.9 | −2.2 |
| Courtland Sutton | WR | DEN | 9 | 9.4 | 7.1 | −2.3 |
| Emeka Egbuka | WR | TB | 7 | 13.9 | 11.1 | −2.7 |
| Ashton Jeanty | RB | LV | 9 | 18.3 | 15.5 | −2.8 |
| Chase Brown | RB | CIN | 8 | 15.6 | 12.7 | −2.9 |
| Colston Loveland | TE | CHI | 9 | 12.3 | 9.3 | −3.0 |
| Adonai Mitchell | WR | NYJ | 5 | 12.9 | 9.7 | −3.2 |
| Kendre Miller | RB | NO | 6 | 9.7 | 6.4 | −3.3 |
| Jadarian Price | RB | SEA | 5 | 9.6 | 6.3 | −3.3 |
| DK Metcalf | WR | PIT | 8 | 13.6 | 9.7 | −3.8 |
| Michael Wilson | WR | ARI | 9 | 18.6 | 13.4 | −5.2 |
Rush yards over expected vs. stacked boxes
Fantasy · Week 9 · Tue, Nov 10
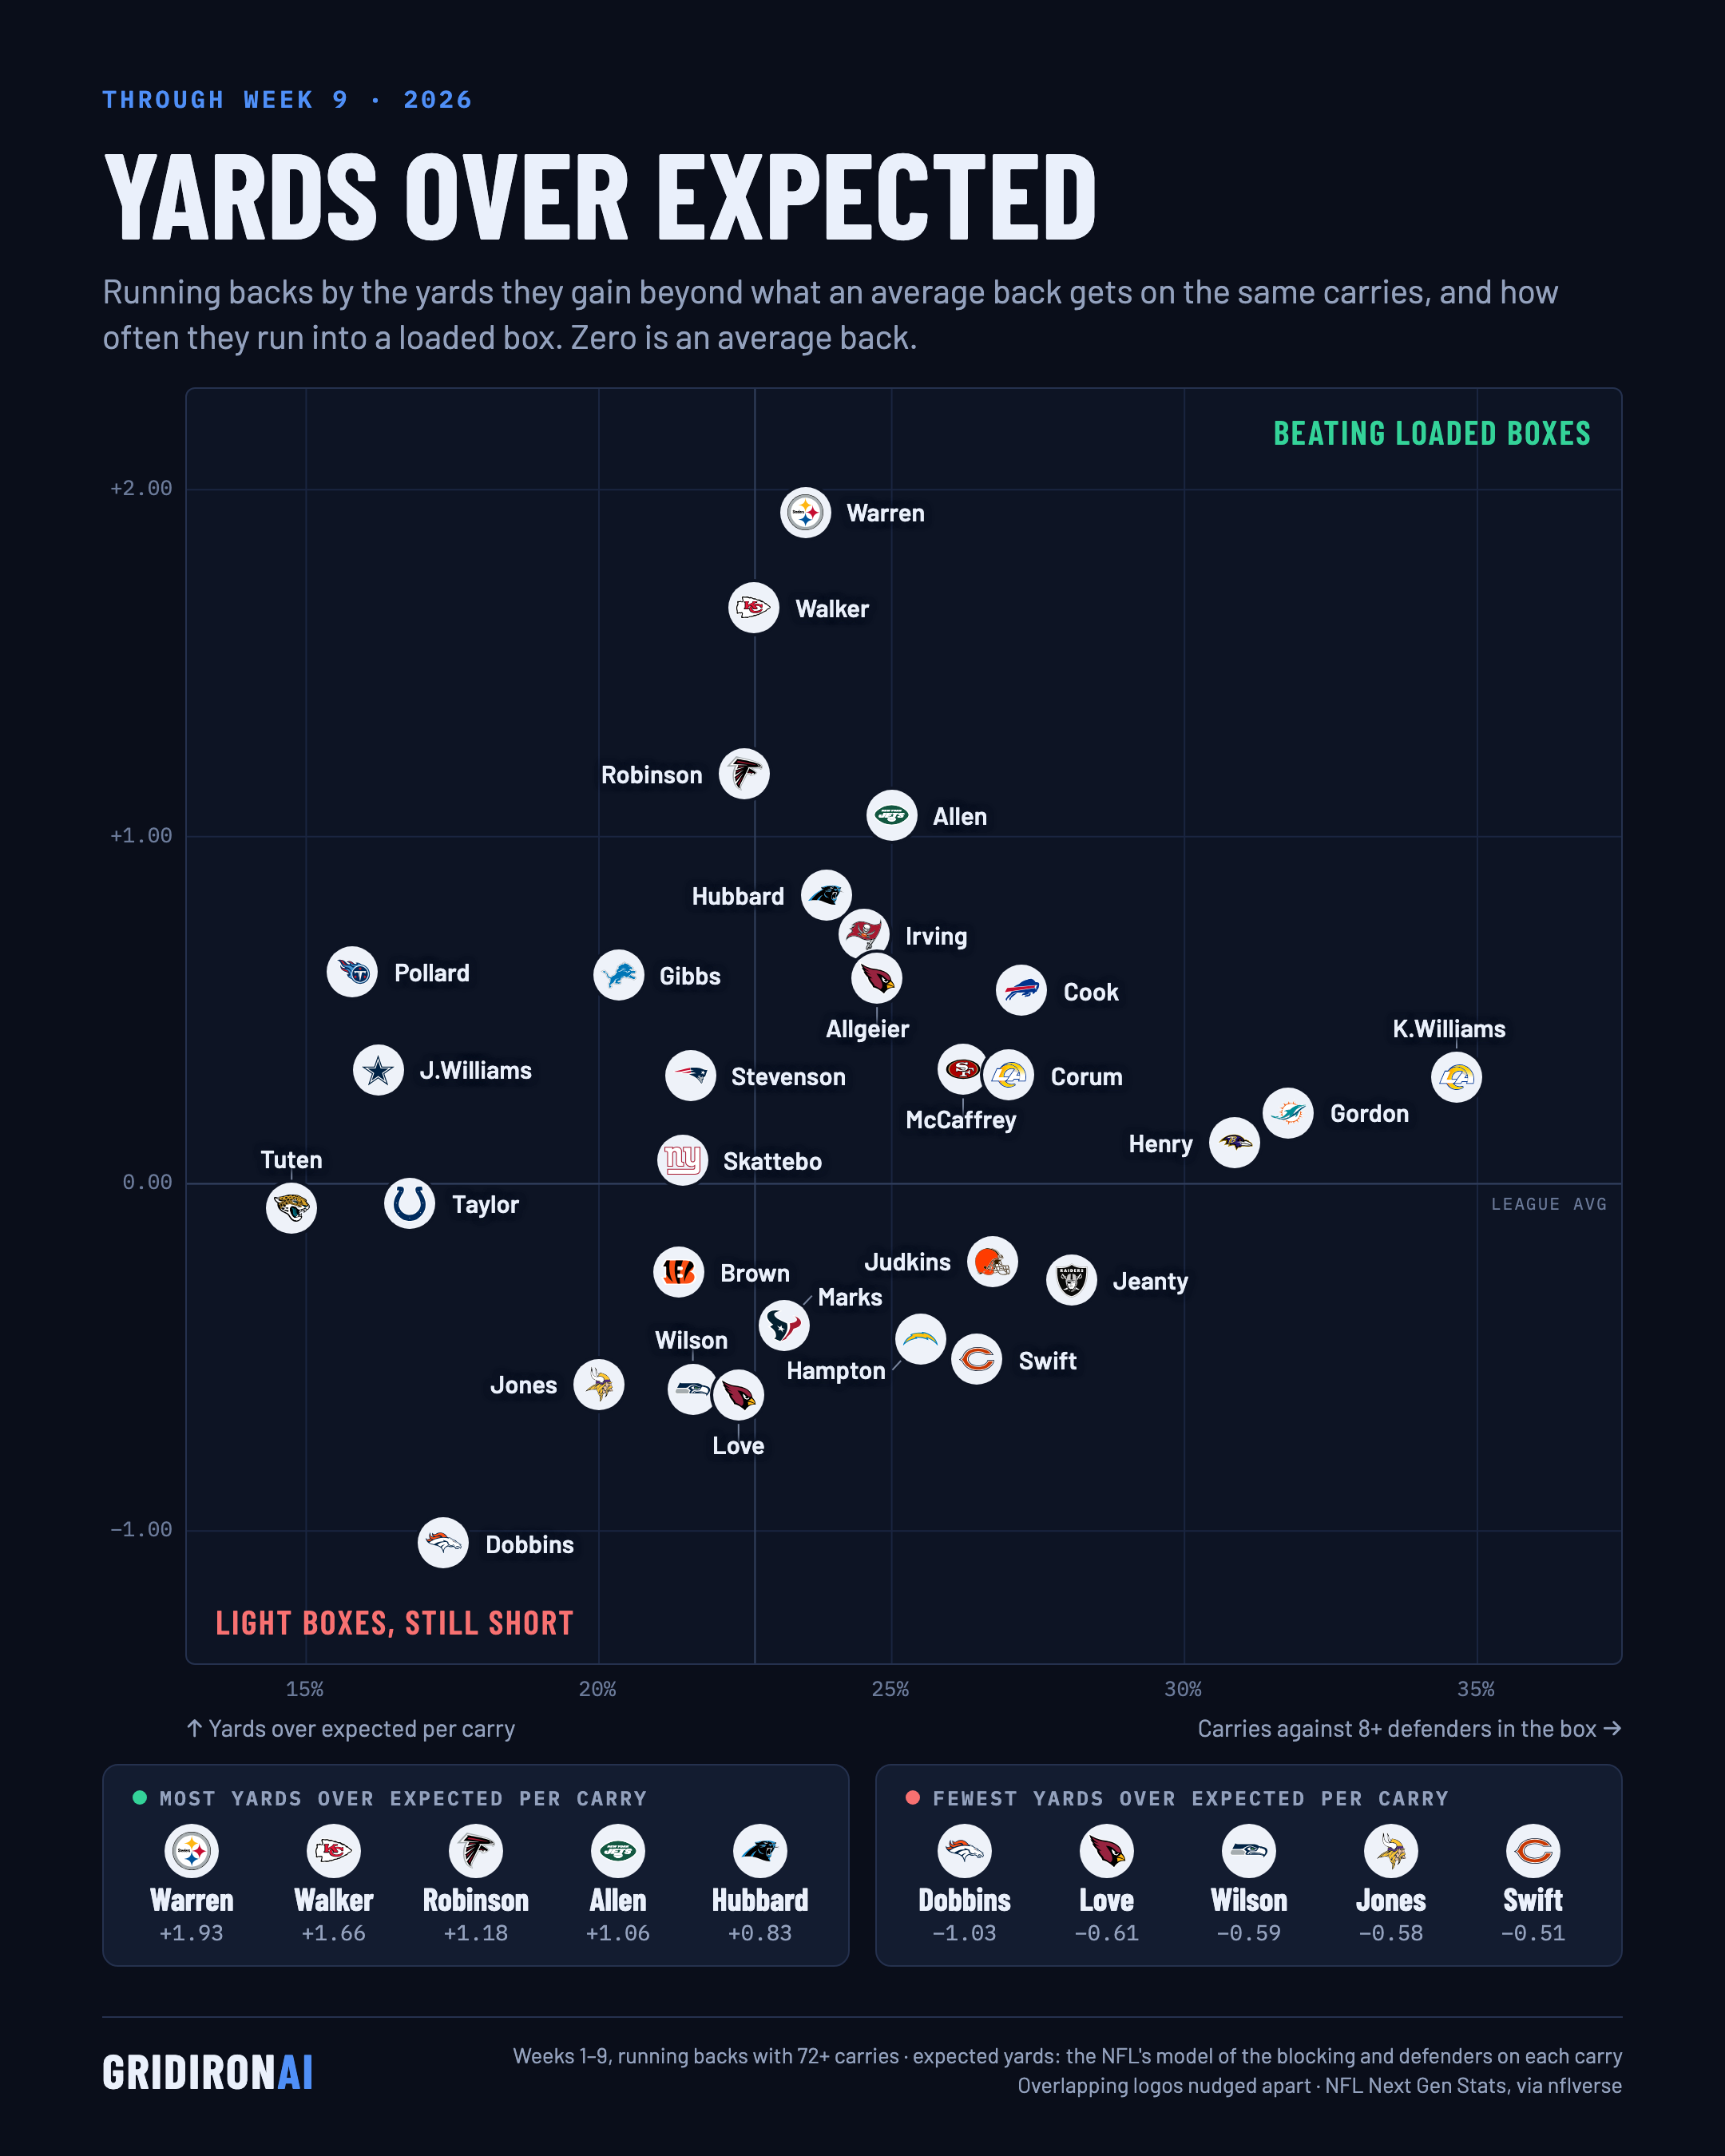
Rush yards over expected through Week 9: how many more yards per carry each running back has gained than an average back would on the same carries (the NFL's Next Gen Stats model, built on where every blocker and defender was at the handoff), against how often he runs into a box of eight or more defenders.
Most yards over expected per carry: Jaylen Warren (PIT, +1.93), Kenneth Walker III (KC, +1.66), Bijan Robinson (ATL, +1.18).
Fewest: J.K. Dobbins (DEN, −1.03), Jeremiyah Love (ARI, −0.61), Emanuel Wilson (SEA, −0.59).
Most loaded boxes: Kyren Williams (LAR, 35%), Ollie Gordon II (MIA, 32%), Derrick Henry (BAL, 31%) of carries. Fewest: Bhayshul Tuten (JAX, 15%), Tony Pollard (TEN, 16%), Javonte Williams (DAL, 16%).
30 running backs with at least 72 carries.
| Running back | Team | Carries | Yards/carry | Yards over expected/carry | Yards over expected | Carries over expected | 8+ in the box |
|---|---|---|---|---|---|---|---|
| Jaylen Warren | PIT | 119 | 5.9 | +1.93 | +222 | 53% | 24% |
| Kenneth Walker III | KC | 159 | 5.5 | +1.66 | +254 | 43% | 23% |
| Bijan Robinson | ATL | 169 | 5.2 | +1.18 | +193 | 45% | 22% |
| Braelon Allen | NYJ | 120 | 5.0 | +1.06 | +124 | 53% | 25% |
| Chuba Hubbard | CAR | 134 | 4.6 | +0.83 | +110 | 43% | 24% |
| Bucky Irving | TB | 167 | 4.9 | +0.70 | +116 | 41% | 25% |
| Tony Pollard | TEN | 133 | 4.5 | +0.61 | +79 | 46% | 16% |
| Tyler Allgeier | ARI | 89 | 4.1 | +0.61 | +54 | 33% | 25% |
| Jahmyr Gibbs | DET | 177 | 4.8 | +0.60 | +105 | 43% | 20% |
| James Cook | BUF | 169 | 4.8 | +0.56 | +92 | 44% | 27% |
| Javonte Williams | DAL | 154 | 4.1 | +0.33 | +49 | 44% | 16% |
| Christian McCaffrey | SF | 102 | 4.5 | +0.32 | +33 | 44% | 26% |
| Blake Corum | LAR | 86 | 5.2 | +0.32 | +26 | 42% | 27% |
| Rhamondre Stevenson | NE | 102 | 3.9 | +0.31 | +31 | 42% | 22% |
| Kyren Williams | LAR | 127 | 4.7 | +0.31 | +38 | 44% | 35% |
| Ollie Gordon II | MIA | 107 | 4.3 | +0.20 | +21 | 38% | 32% |
| Derrick Henry | BAL | 175 | 3.9 | +0.12 | +20 | 36% | 31% |
| Cam Skattebo | NYG | 98 | 4.3 | +0.07 | +7 | 36% | 21% |
| Jonathan Taylor | IND | 161 | 4.1 | −0.06 | −9 | 35% | 17% |
| Bhayshul Tuten | JAX | 122 | 4.3 | −0.07 | −8 | 36% | 15% |
| Quinshon Judkins | CLE | 116 | 3.3 | −0.22 | −26 | 37% | 27% |
| Chase Brown | CIN | 103 | 3.9 | −0.25 | −26 | 42% | 21% |
| Ashton Jeanty | LV | 114 | 3.2 | −0.28 | −31 | 34% | 28% |
| Woody Marks | HOU | 95 | 3.6 | −0.41 | −36 | 34% | 23% |
| Omarion Hampton | LAC | 102 | 3.6 | −0.45 | −46 | 36% | 25% |
| D'Andre Swift | CHI | 155 | 3.7 | −0.51 | −75 | 36% | 26% |
| Aaron Jones | MIN | 115 | 4.1 | −0.58 | −66 | 37% | 20% |
| Emanuel Wilson | SEA | 111 | 3.6 | −0.59 | −65 | 35% | 22% |
| Jeremiyah Love | ARI | 76 | 3.5 | −0.61 | −46 | 38% | 22% |
| J.K. Dobbins | DEN | 98 | 3.3 | −1.03 | −100 | 26% | 17% |
Draft day vs. now: QB
Fantasy · Week 10 · Tue, Nov 10
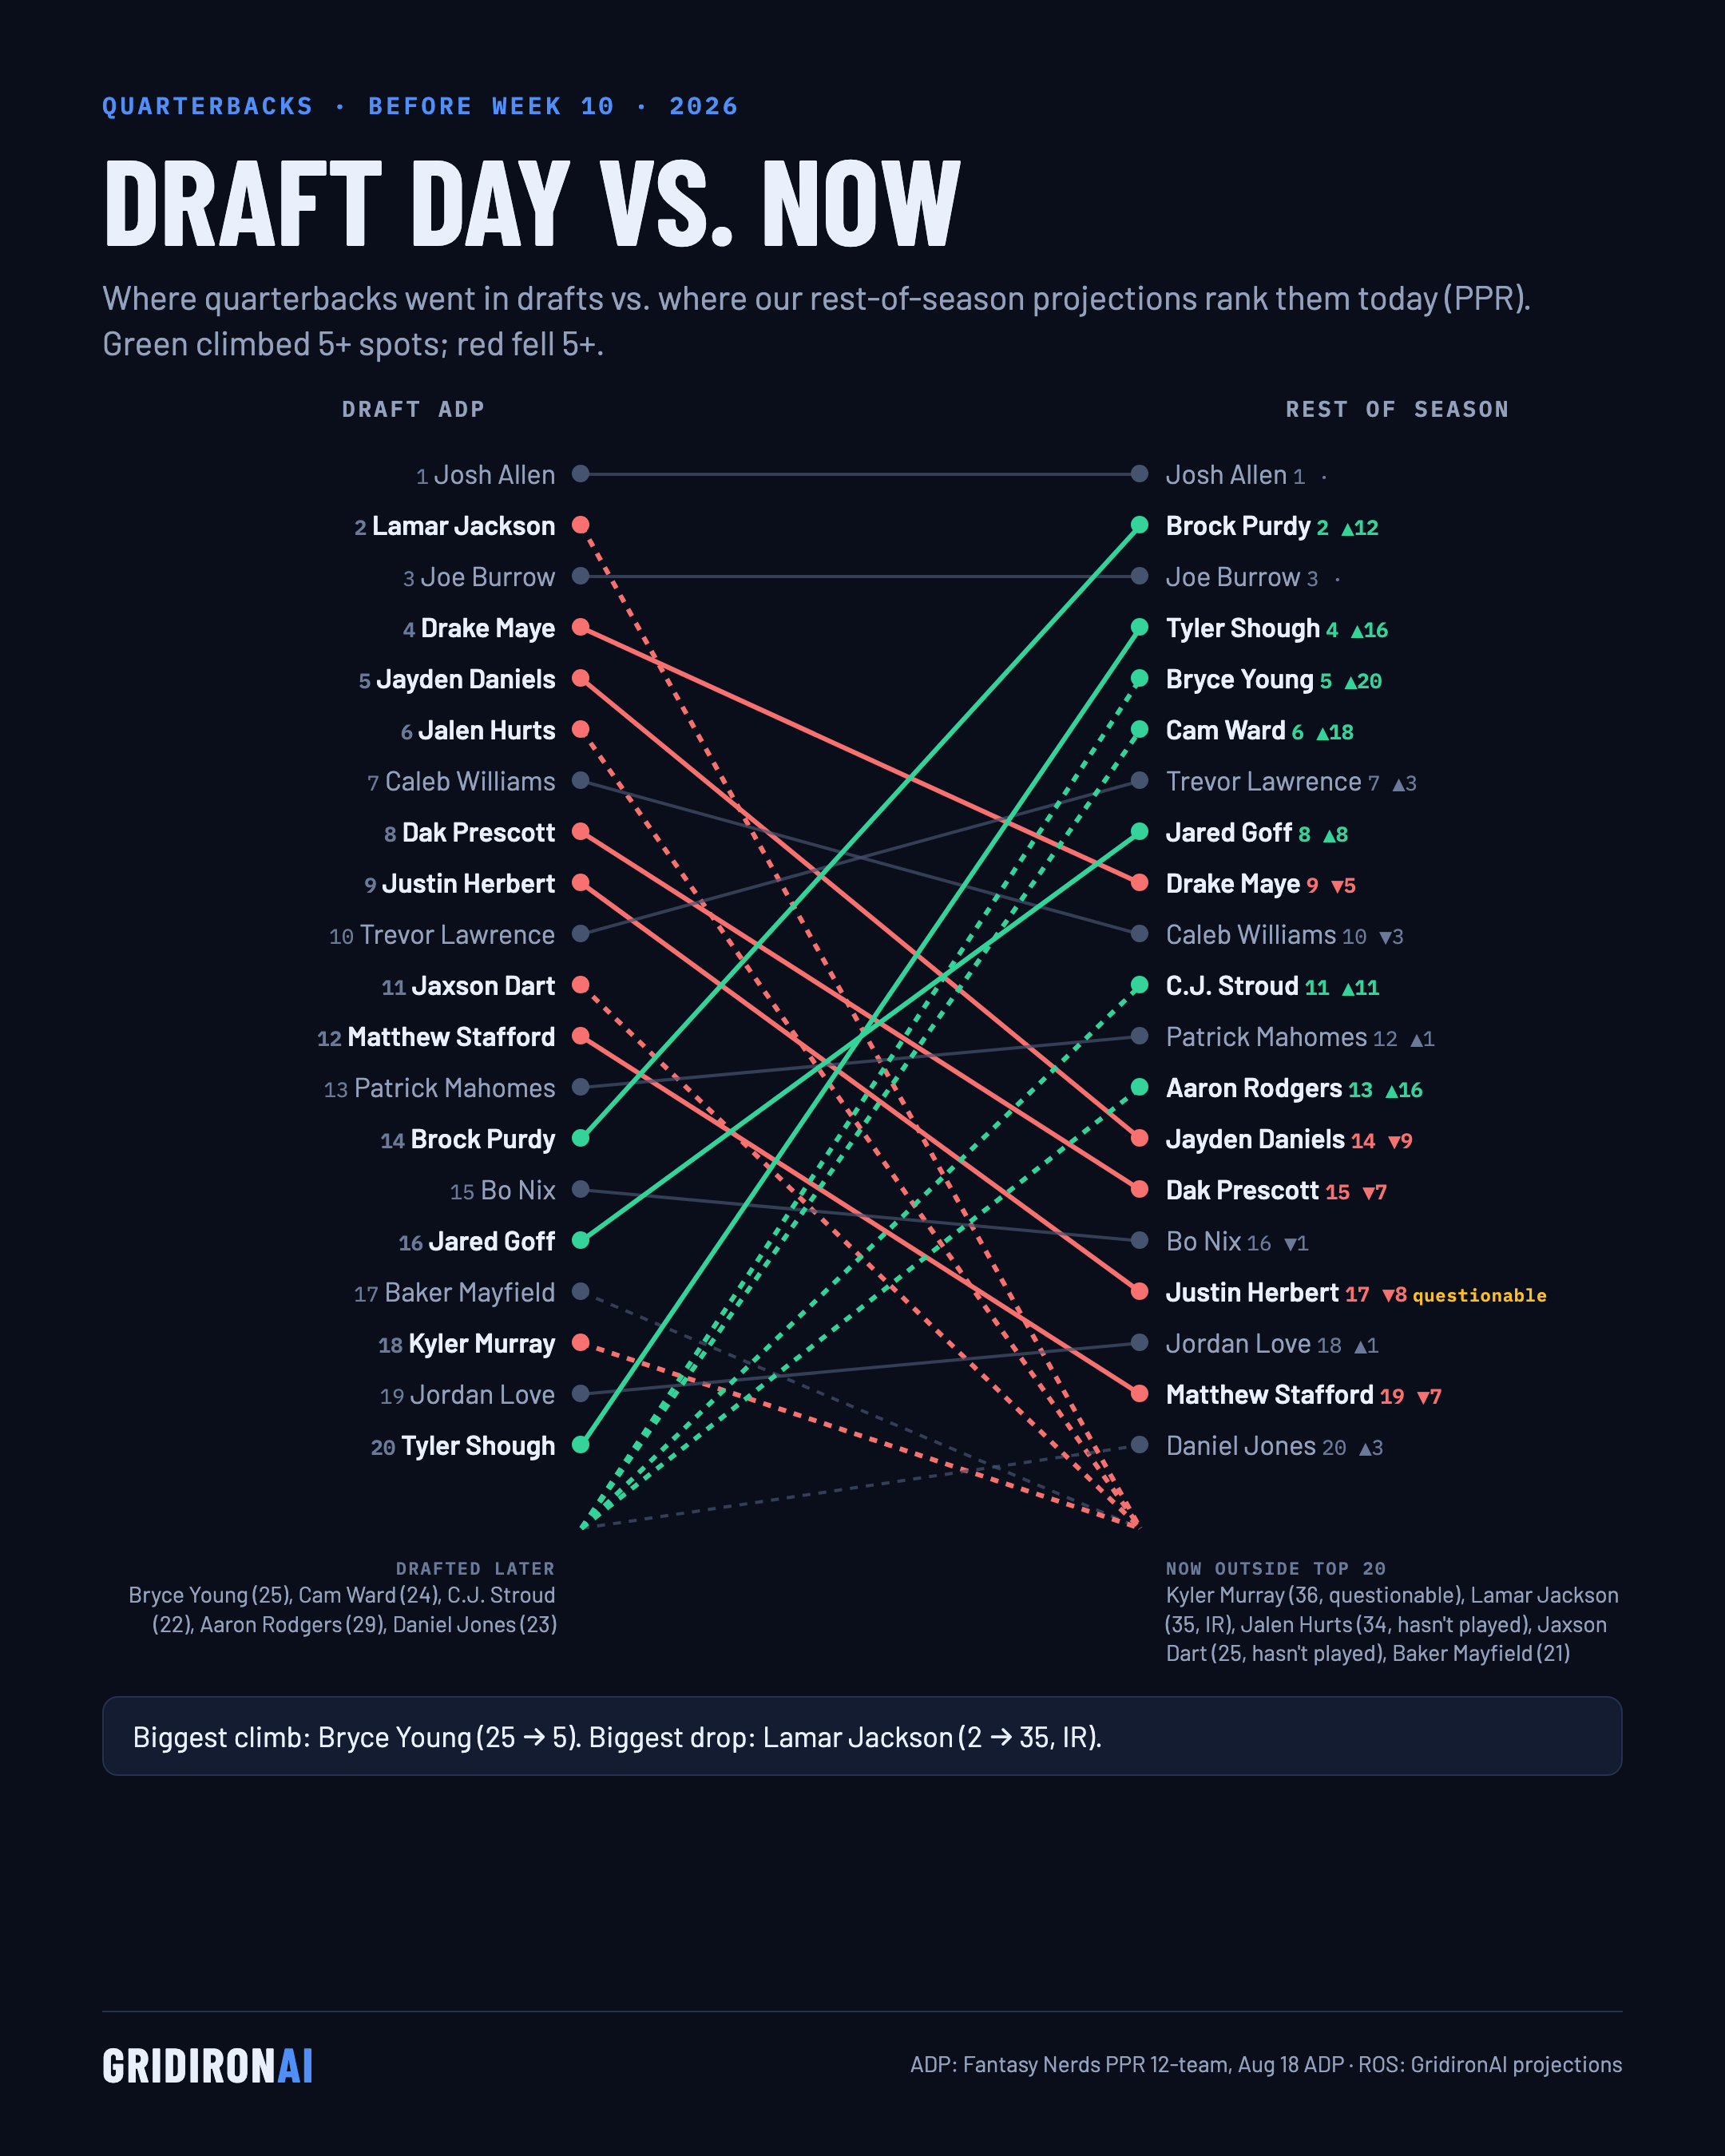
Where quarterbacks went in August drafts (Fantasy Nerds ADP) vs. where our rest-of-season projections rank them before Week 10.
Biggest climb: Bryce Young, QB25 on draft day, QB5 now.
Biggest fall: Lamar Jackson, QB2 on draft day, QB35 now.
| Player | Draft day | Now | Move | Pts/game |
|---|---|---|---|---|
| Josh Allen | QB1 | QB1 | +0 | 14.7 |
| Lamar Jackson | QB2 | QB35 | −33 | 5.3 |
| Joe Burrow | QB3 | QB3 | +0 | 13.0 |
| Drake Maye | QB4 | QB9 | −5 | 12.3 |
| Jayden Daniels | QB5 | QB14 | −9 | 10.6 |
| Jalen Hurts | QB6 | QB34 | −28 | 5.4 |
| Caleb Williams | QB7 | QB10 | −3 | 12.3 |
| Dak Prescott | QB8 | QB15 | −7 | 11.3 |
| Justin Herbert | QB9 | QB17 | −8 | 9.8 |
| Trevor Lawrence | QB10 | QB7 | +3 | 11.2 |
| Jaxson Dart | QB11 | QB25 | −14 | 7.2 |
| Matthew Stafford | QB12 | QB19 | −7 | 10.5 |
| Patrick Mahomes | QB13 | QB12 | +1 | 10.9 |
| Brock Purdy | QB14 | QB2 | +12 | 14.5 |
| Bo Nix | QB15 | QB16 | −1 | 11.2 |
| Jared Goff | QB16 | QB8 | +8 | 11.1 |
| Baker Mayfield | QB17 | QB21 | −4 | 8.9 |
| Kyler Murray | QB18 | QB36 | −18 | 4.7 |
| Jordan Love | QB19 | QB18 | +1 | 10.8 |
| Tyler Shough | QB20 | QB4 | +16 | 12.2 |
| C.J. Stroud | QB22 | QB11 | +11 | 10.9 |
| Daniel Jones | QB23 | QB20 | +3 | 9.5 |
| Cam Ward | QB24 | QB6 | +18 | 11.3 |
| Bryce Young | QB25 | QB5 | +20 | 11.6 |
| Aaron Rodgers | QB29 | QB13 | +16 | 10.7 |
Draft day vs. now: RB
Fantasy · Week 10 · Tue, Nov 10
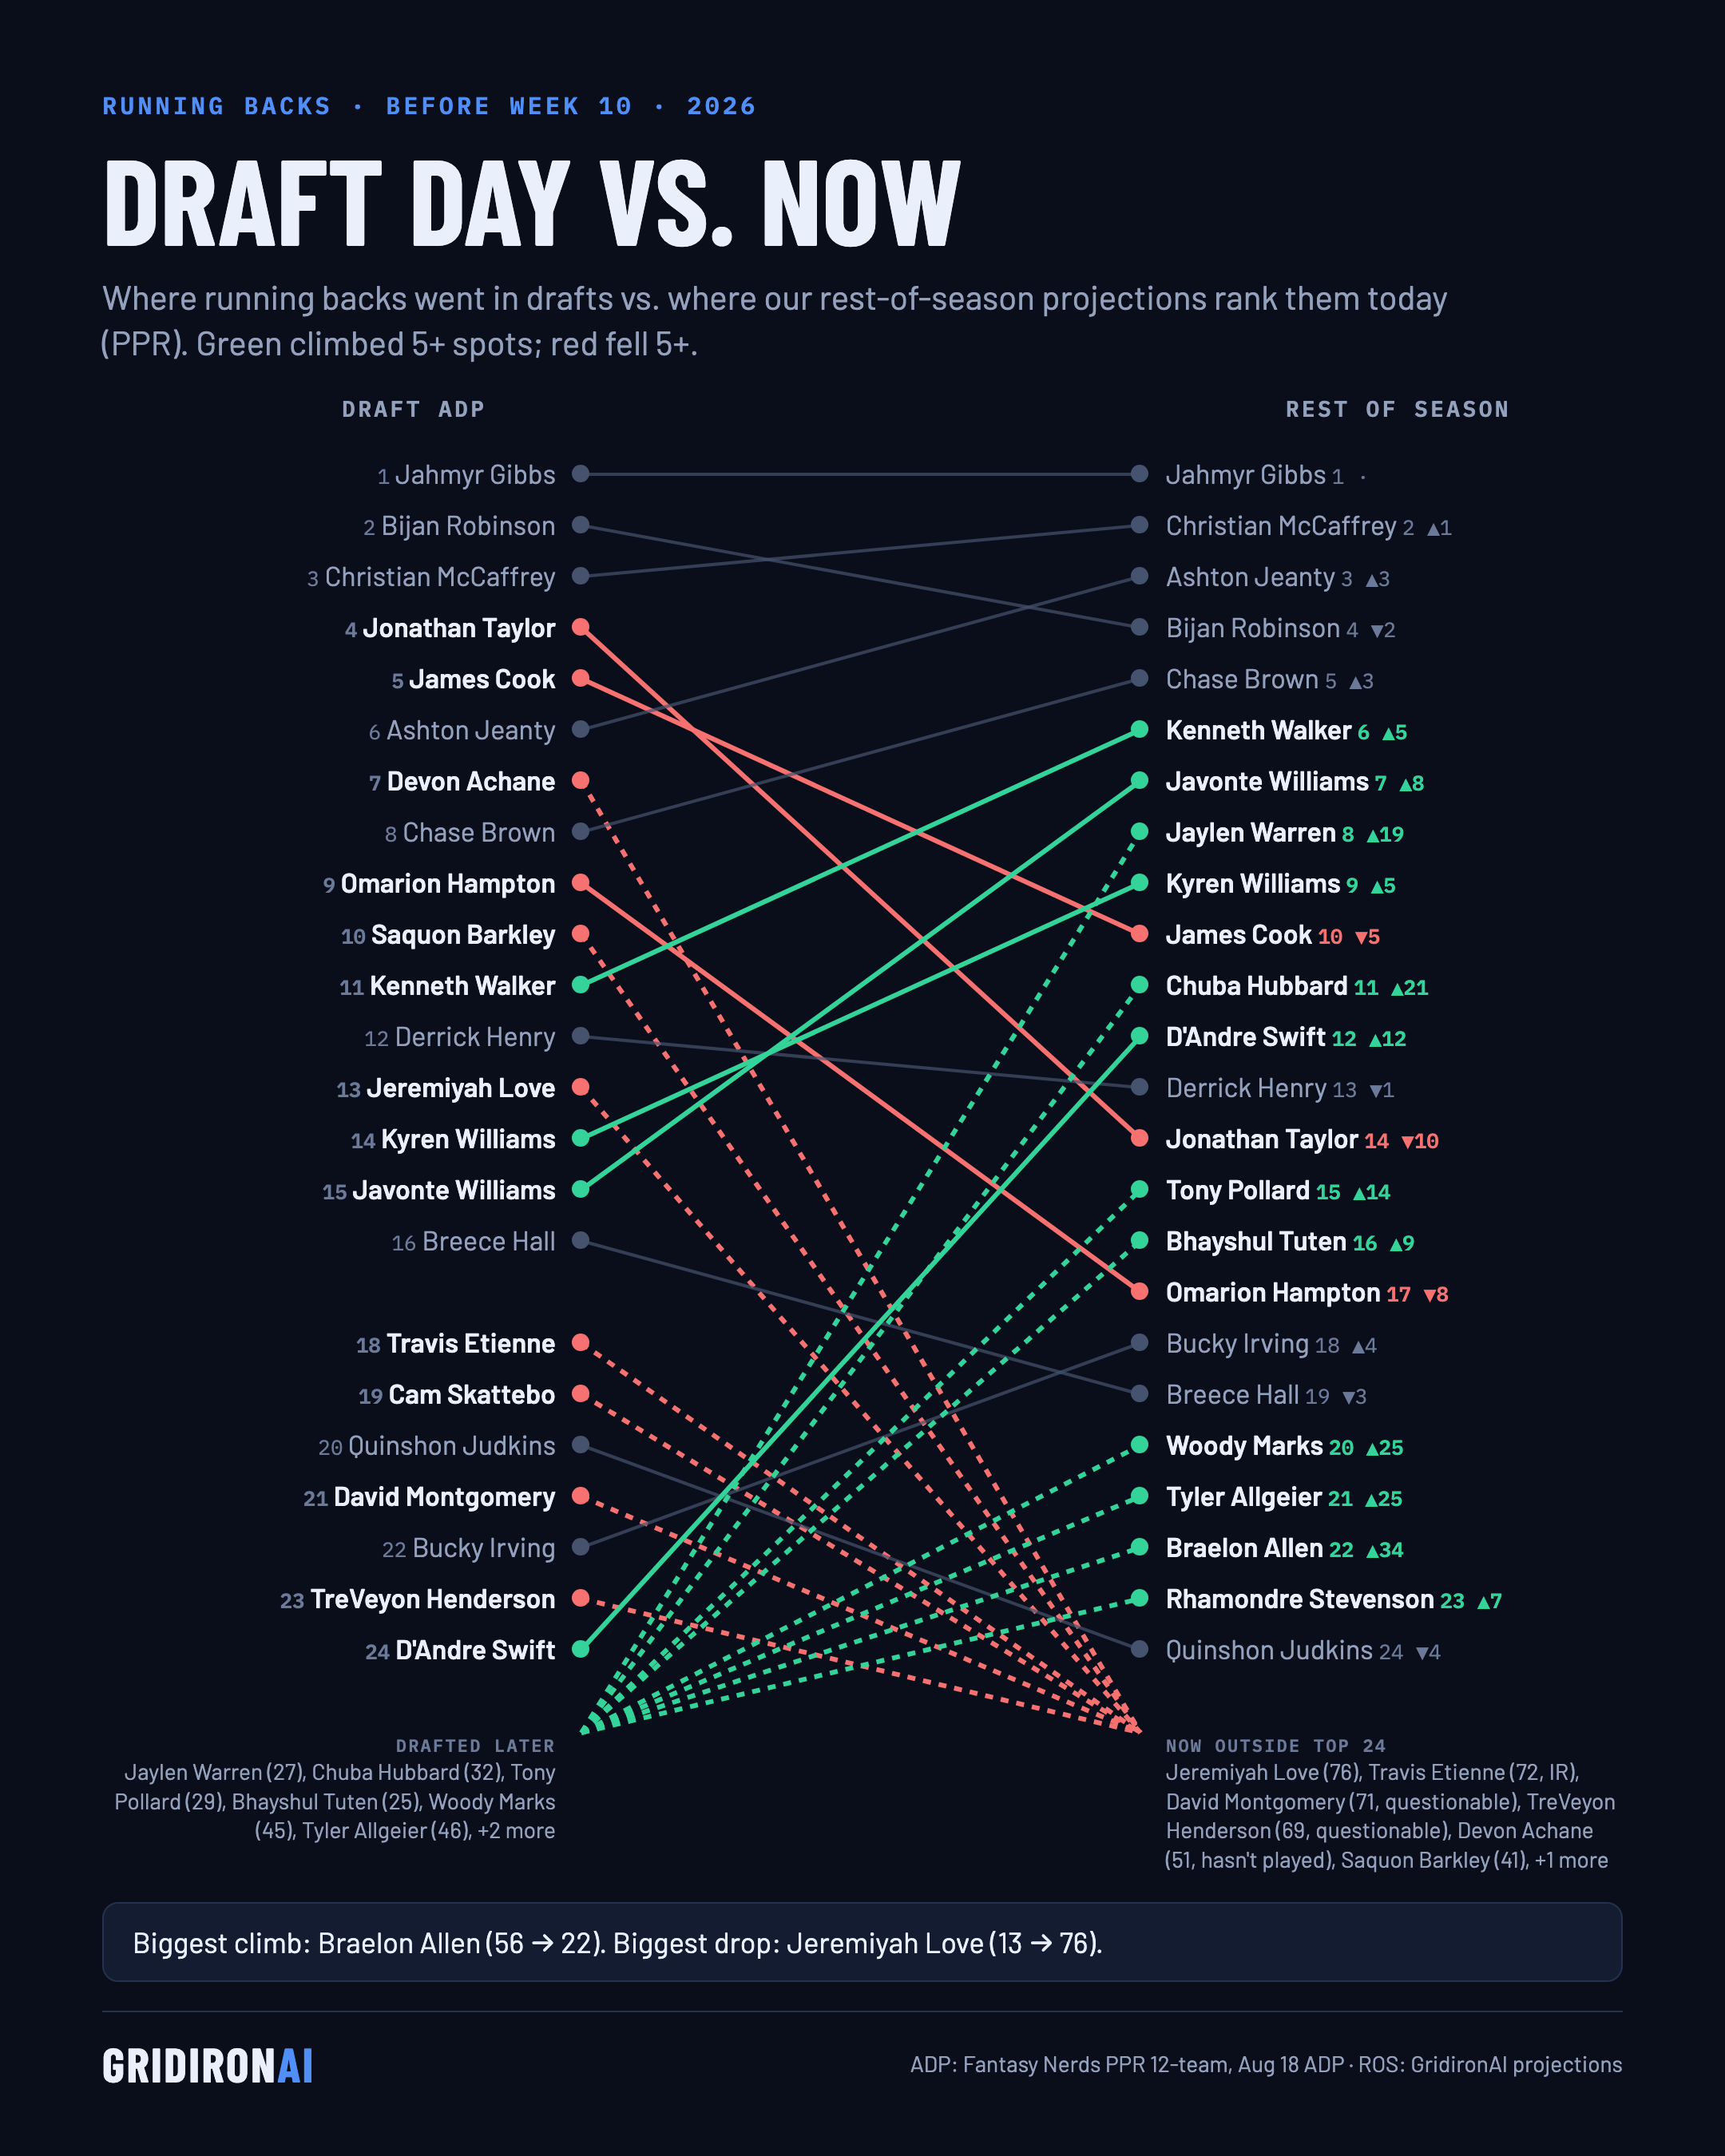
Where running backs went in August drafts (Fantasy Nerds ADP) vs. where our rest-of-season projections rank them before Week 10.
Biggest climb: Braelon Allen, RB56 on draft day, RB22 now.
Biggest fall: Jeremiyah Love, RB13 on draft day, RB76 now.
| Player | Draft day | Now | Move | Pts/game |
|---|---|---|---|---|
| Jahmyr Gibbs | RB1 | RB1 | +0 | 16.9 |
| Bijan Robinson | RB2 | RB4 | −2 | 14.4 |
| Christian McCaffrey | RB3 | RB2 | +1 | 13.7 |
| Jonathan Taylor | RB4 | RB14 | −10 | 11.0 |
| James Cook | RB5 | RB10 | −5 | 10.8 |
| Ashton Jeanty | RB6 | RB3 | +3 | 14.5 |
| Devon Achane | RB7 | RB51 | −44 | 5.1 |
| Chase Brown | RB8 | RB5 | +3 | 12.6 |
| Omarion Hampton | RB9 | RB17 | −8 | 9.6 |
| Saquon Barkley | RB10 | RB41 | −31 | 7.0 |
| Kenneth Walker | RB11 | RB6 | +5 | 12.0 |
| Derrick Henry | RB12 | RB13 | −1 | 11.0 |
| Jeremiyah Love | RB13 | RB76 | −63 | 2.9 |
| Kyren Williams | RB14 | RB9 | +5 | 12.8 |
| Javonte Williams | RB15 | RB7 | +8 | 13.2 |
| Breece Hall | RB16 | RB19 | −3 | 10.5 |
| Travis Etienne | RB18 | RB72 | −54 | 2.7 |
| Cam Skattebo | RB19 | RB32 | −13 | 7.0 |
| Quinshon Judkins | RB20 | RB24 | −4 | 9.0 |
| David Montgomery | RB21 | RB71 | −50 | 2.7 |
| Bucky Irving | RB22 | RB18 | +4 | 10.5 |
| TreVeyon Henderson | RB23 | RB69 | −46 | 3.3 |
| D'Andre Swift | RB24 | RB12 | +12 | 11.2 |
| Bhayshul Tuten | RB25 | RB16 | +9 | 9.6 |
| Jaylen Warren | RB27 | RB8 | +19 | 11.6 |
| Tony Pollard | RB29 | RB15 | +14 | 9.6 |
| Rhamondre Stevenson | RB30 | RB23 | +7 | 9.2 |
| Chuba Hubbard | RB32 | RB11 | +21 | 10.6 |
| Woody Marks | RB45 | RB20 | +25 | 8.5 |
| Tyler Allgeier | RB46 | RB21 | +25 | 9.5 |
| Braelon Allen | RB56 | RB22 | +34 | 9.2 |
Draft day vs. now: WR
Fantasy · Week 10 · Tue, Nov 10
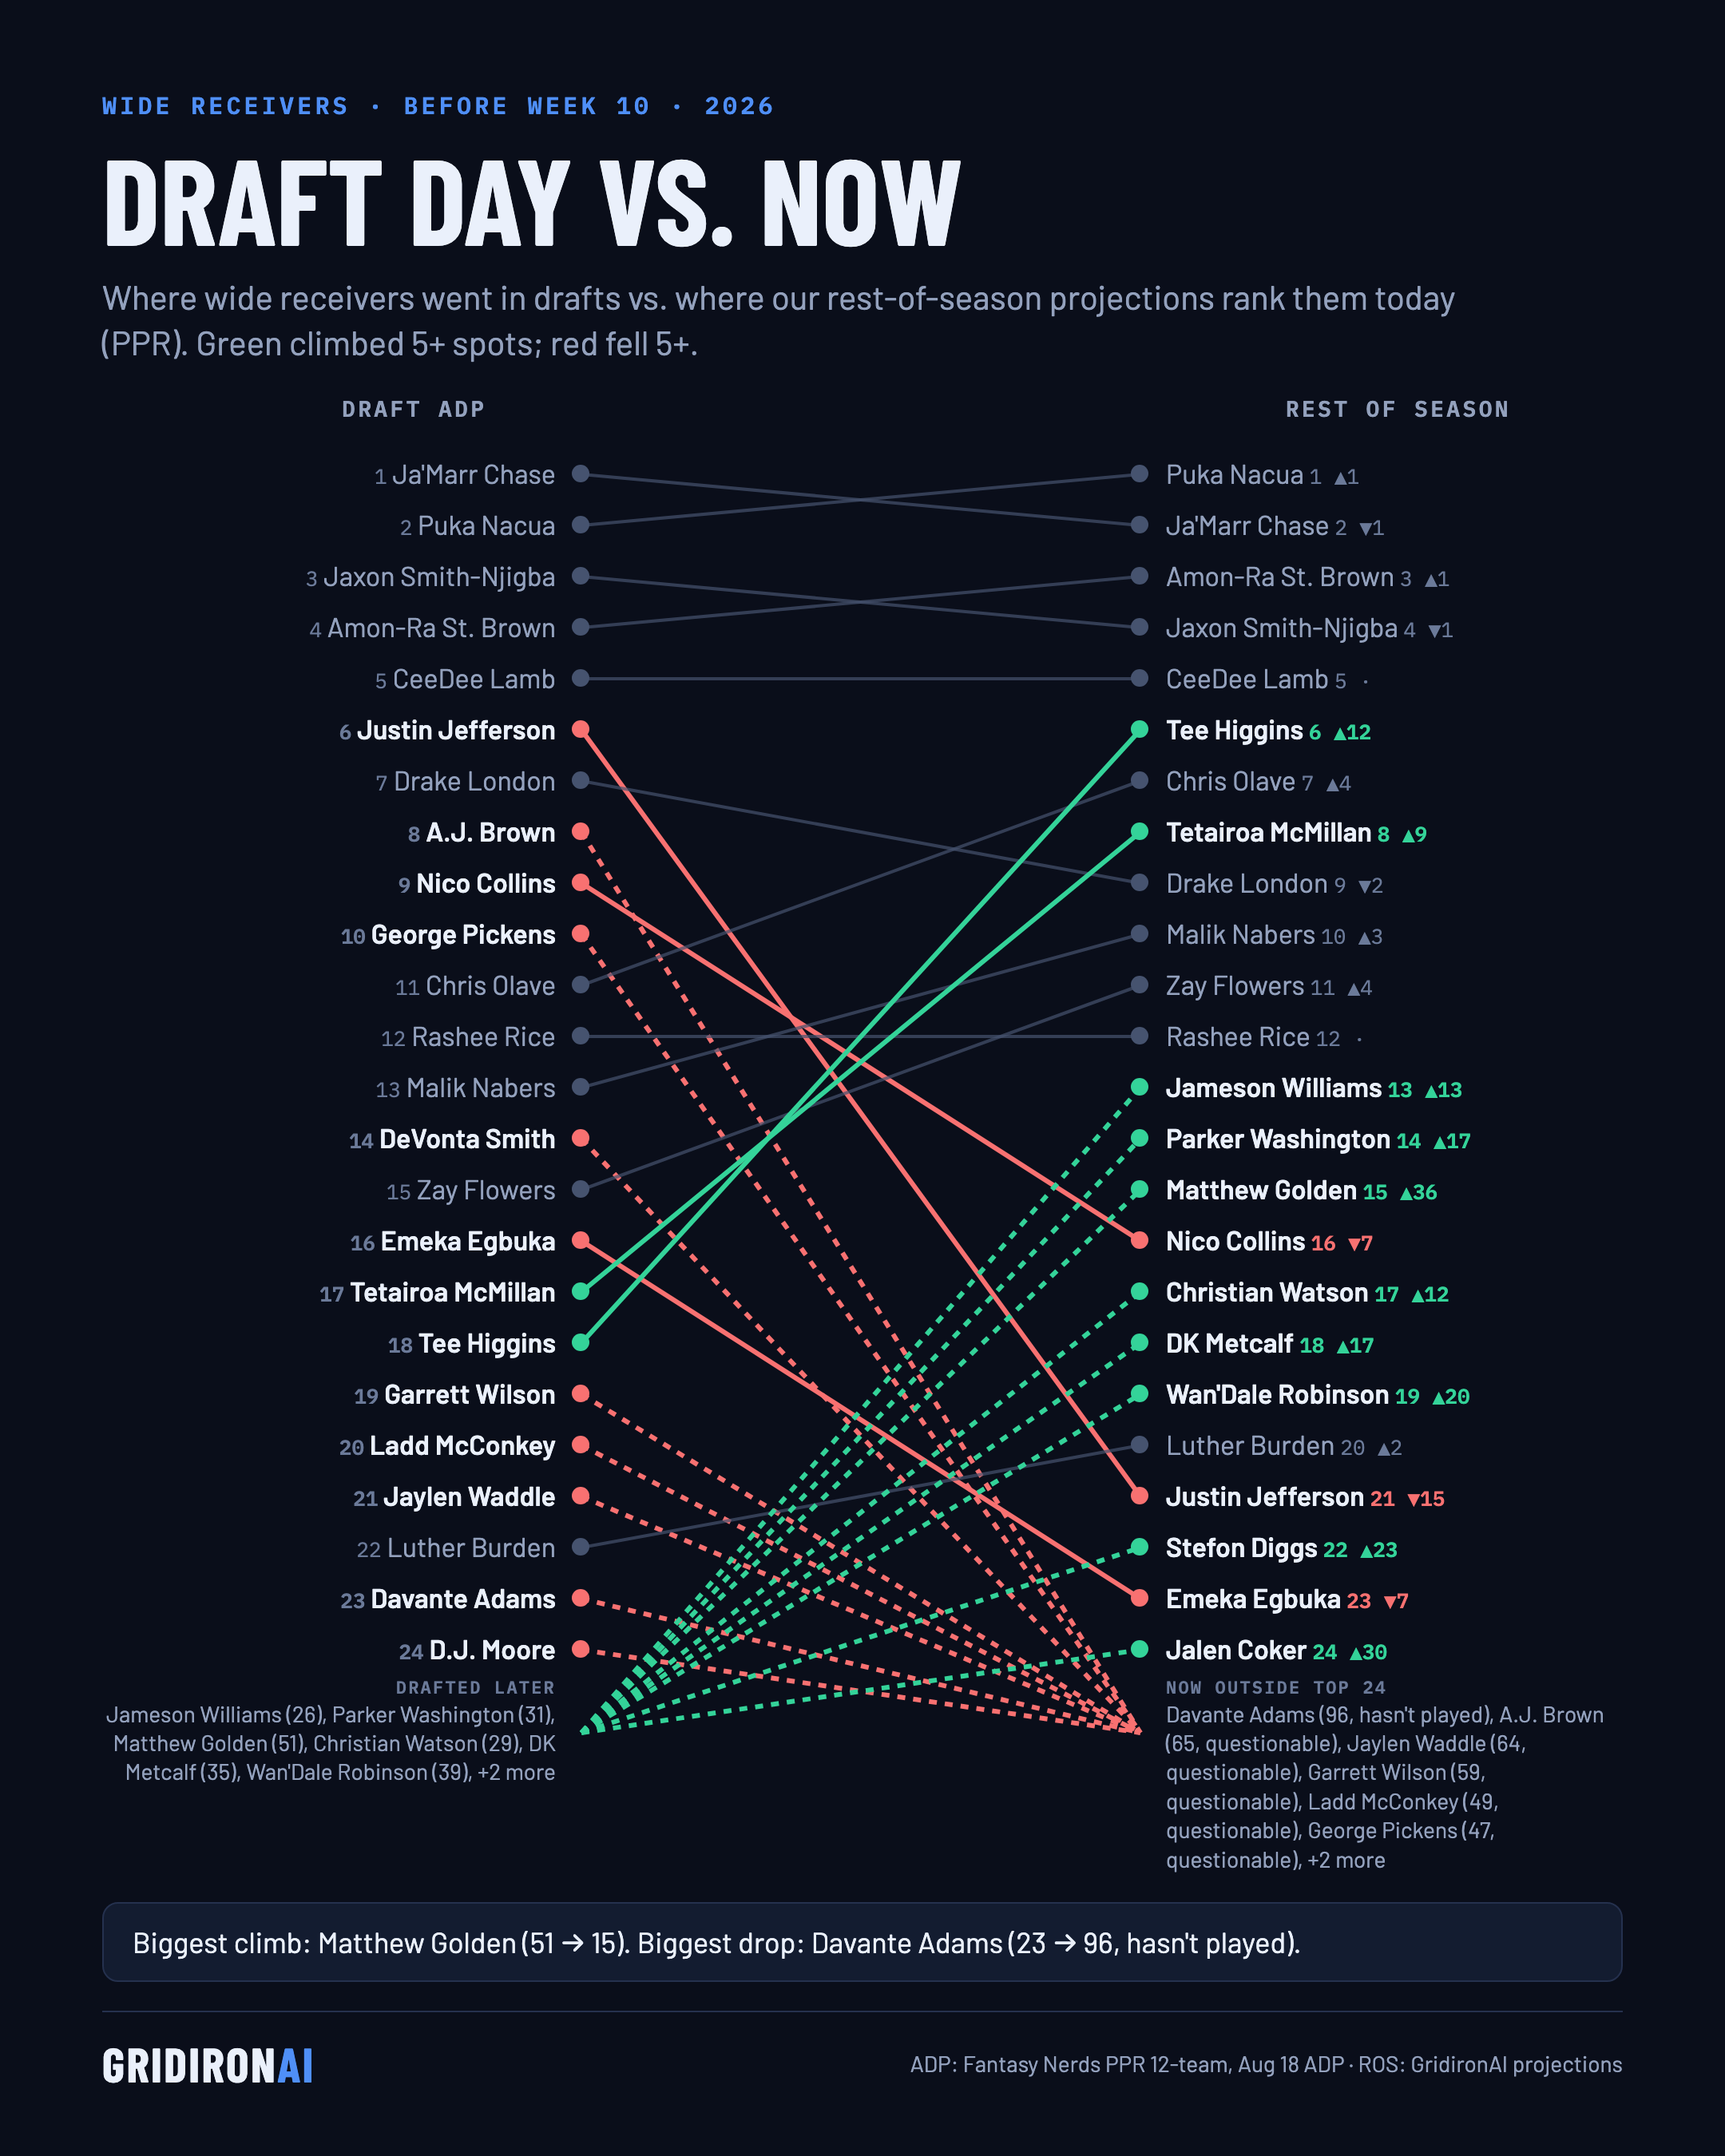
Where wide receivers went in August drafts (Fantasy Nerds ADP) vs. where our rest-of-season projections rank them before Week 10.
Biggest climb: Matthew Golden, WR51 on draft day, WR15 now.
Biggest fall: Davante Adams, WR23 on draft day, WR96 now.
| Player | Draft day | Now | Move | Pts/game |
|---|---|---|---|---|
| Ja'Marr Chase | WR1 | WR2 | −1 | 15.0 |
| Puka Nacua | WR2 | WR1 | +1 | 16.9 |
| Jaxon Smith-Njigba | WR3 | WR4 | −1 | 15.8 |
| Amon-Ra St. Brown | WR4 | WR3 | +1 | 14.6 |
| CeeDee Lamb | WR5 | WR5 | +0 | 15.5 |
| Justin Jefferson | WR6 | WR21 | −15 | 8.5 |
| Drake London | WR7 | WR9 | −2 | 12.7 |
| A.J. Brown | WR8 | WR65 | −57 | 5.3 |
| Nico Collins | WR9 | WR16 | −7 | 9.4 |
| George Pickens | WR10 | WR47 | −37 | 6.7 |
| Chris Olave | WR11 | WR7 | +4 | 11.7 |
| Rashee Rice | WR12 | WR12 | +0 | 10.6 |
| Malik Nabers | WR13 | WR10 | +3 | 11.3 |
| DeVonta Smith | WR14 | WR44 | −30 | 7.0 |
| Zay Flowers | WR15 | WR11 | +4 | 12.0 |
| Emeka Egbuka | WR16 | WR23 | −7 | 9.3 |
| Tetairoa McMillan | WR17 | WR8 | +9 | 11.5 |
| Tee Higgins | WR18 | WR6 | +12 | 13.7 |
| Garrett Wilson | WR19 | WR59 | −40 | 5.7 |
| Ladd McConkey | WR20 | WR49 | −29 | 5.8 |
| Jaylen Waddle | WR21 | WR64 | −43 | 5.3 |
| Luther Burden | WR22 | WR20 | +2 | 9.7 |
| Davante Adams | WR23 | WR96 | −73 | 3.5 |
| D.J. Moore | WR24 | WR42 | −18 | 6.3 |
| Jameson Williams | WR26 | WR13 | +13 | 10.5 |
| Christian Watson | WR29 | WR17 | +12 | 10.4 |
| Parker Washington | WR31 | WR14 | +17 | 10.0 |
| DK Metcalf | WR35 | WR18 | +17 | 9.2 |
| Wan'Dale Robinson | WR39 | WR19 | +20 | 8.9 |
| Stefon Diggs | WR45 | WR22 | +23 | 8.4 |
| Matthew Golden | WR51 | WR15 | +36 | 10.9 |
| Jalen Coker | WR54 | WR24 | +30 | 8.2 |
Draft day vs. now: TE
Fantasy · Week 10 · Tue, Nov 10
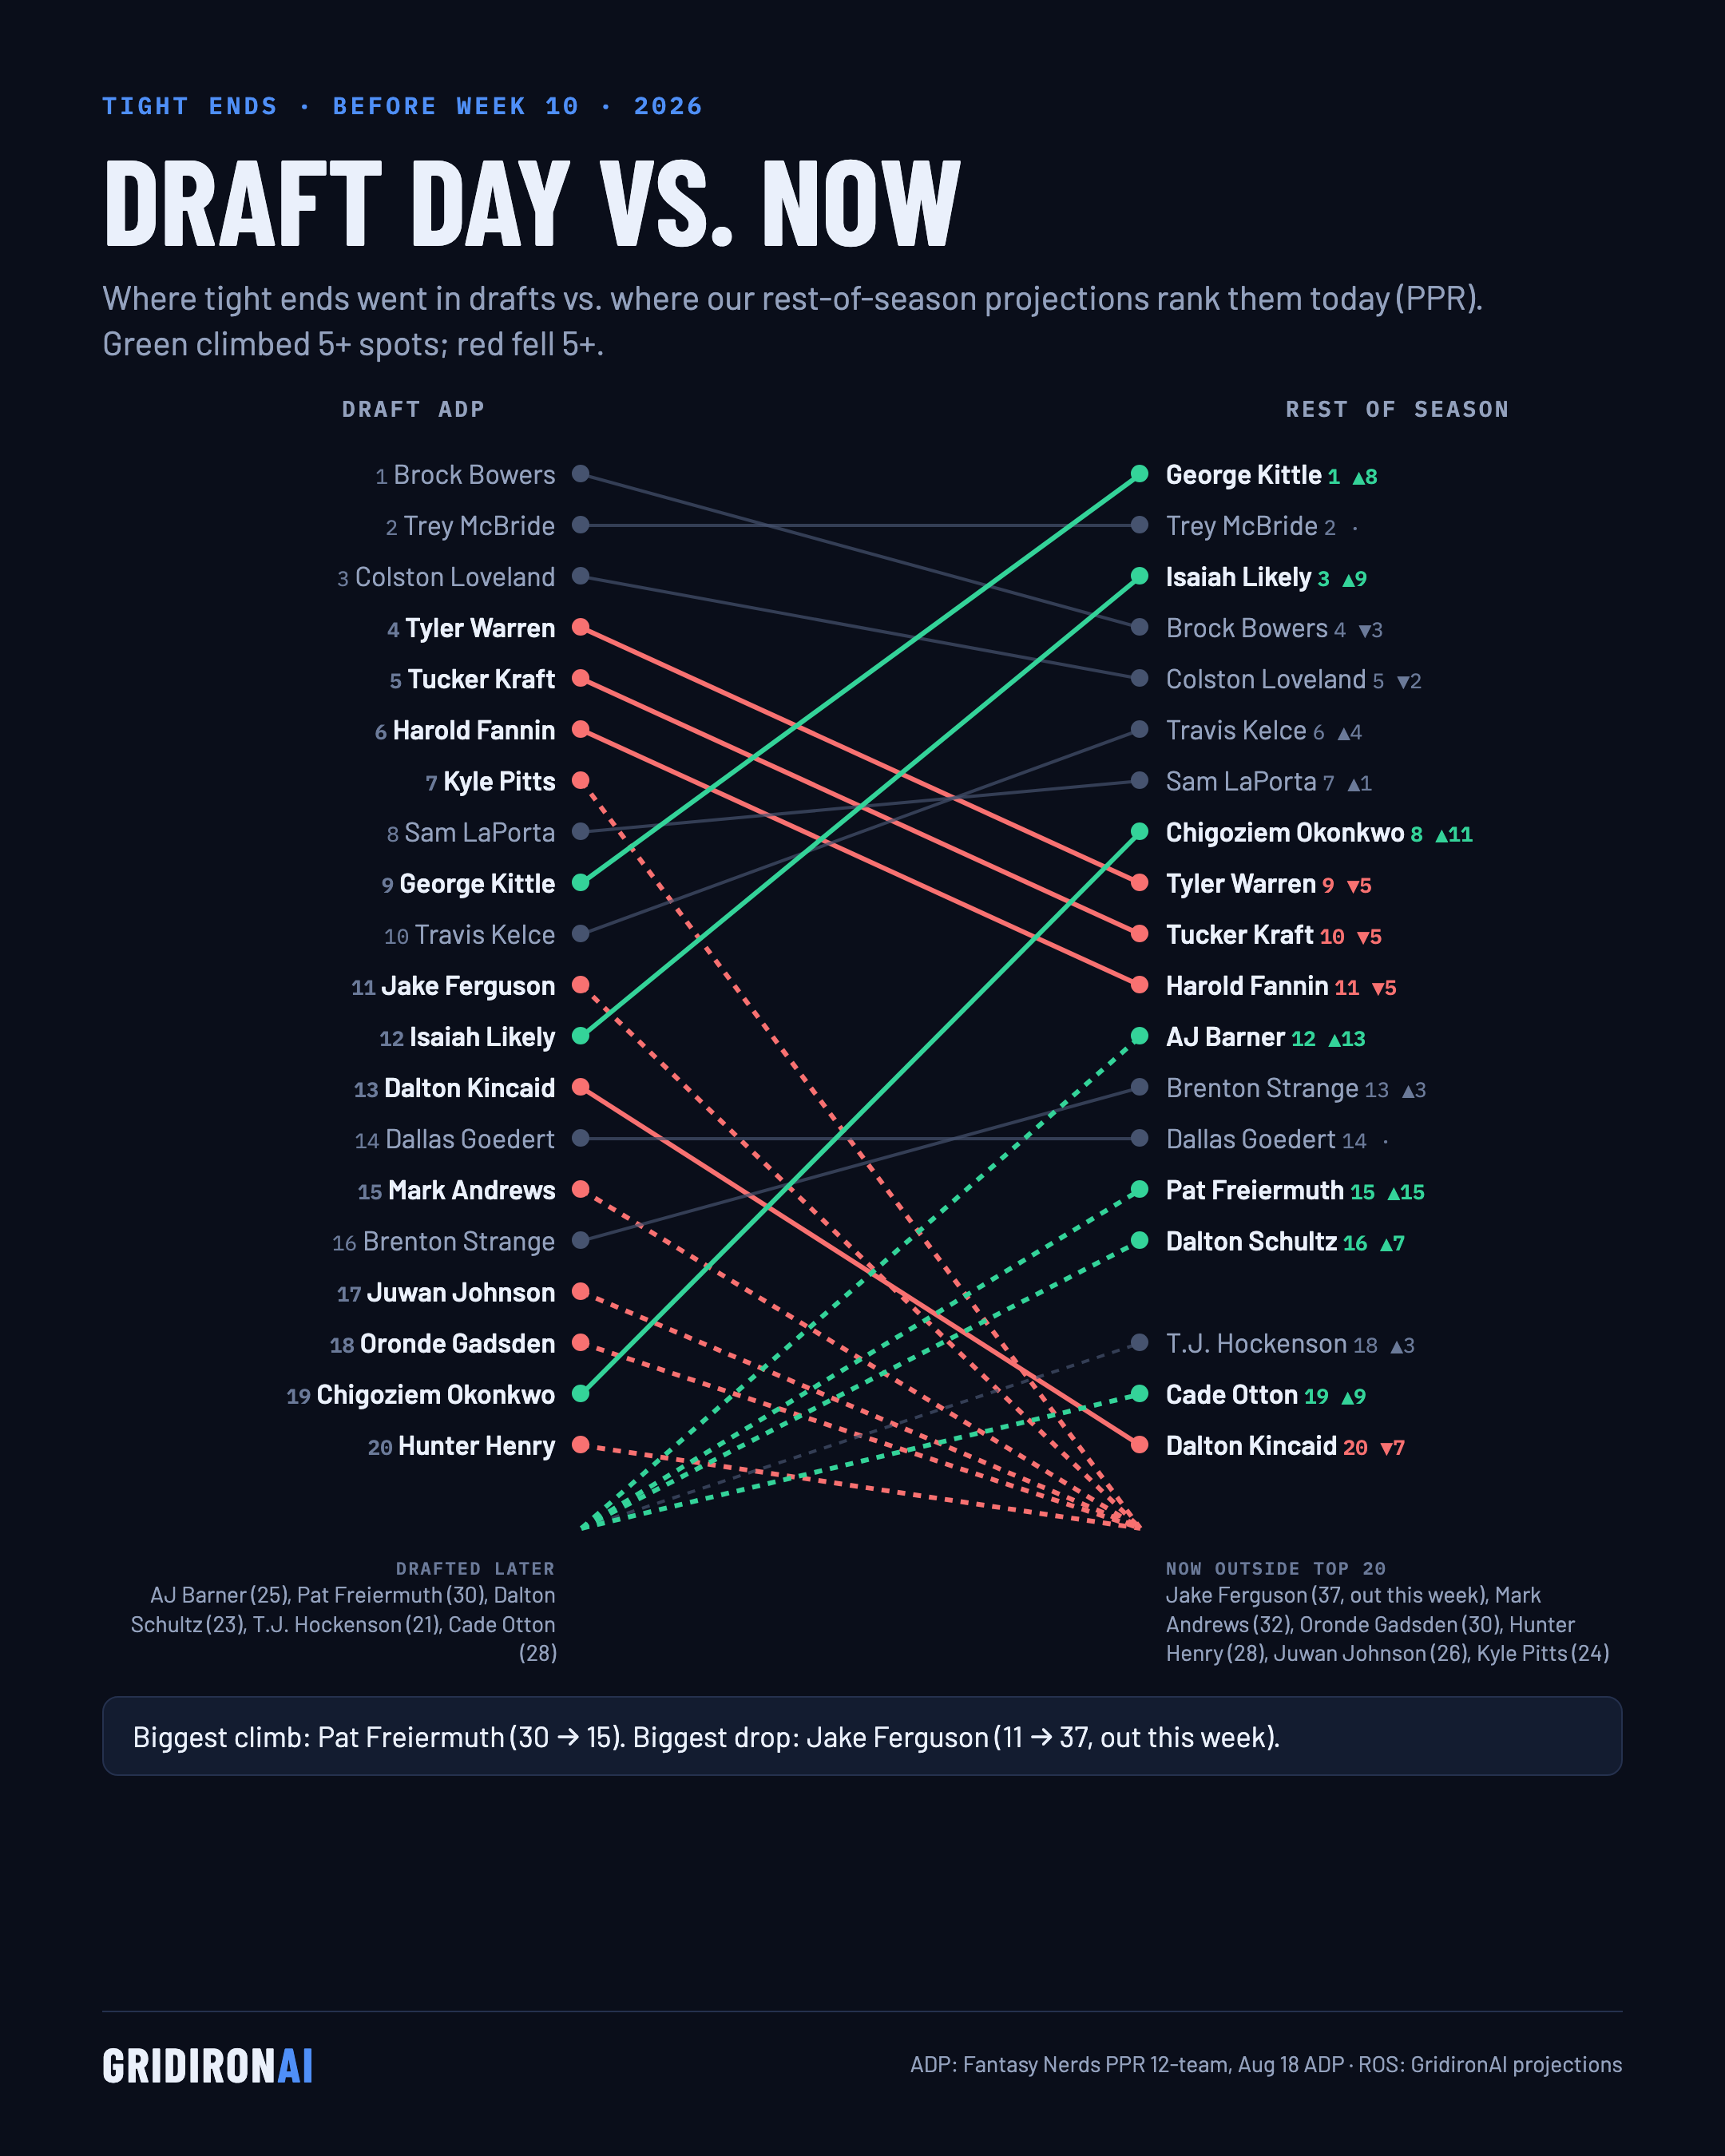
Where tight ends went in August drafts (Fantasy Nerds ADP) vs. where our rest-of-season projections rank them before Week 10.
Biggest climb: Pat Freiermuth, TE30 on draft day, TE15 now.
Biggest fall: Jake Ferguson, TE11 on draft day, TE37 now.
| Player | Draft day | Now | Move | Pts/game |
|---|---|---|---|---|
| Brock Bowers | TE1 | TE4 | −3 | 10.5 |
| Trey McBride | TE2 | TE2 | +0 | 11.9 |
| Colston Loveland | TE3 | TE5 | −2 | 9.9 |
| Tyler Warren | TE4 | TE9 | −5 | 8.9 |
| Tucker Kraft | TE5 | TE10 | −5 | 8.6 |
| Harold Fannin | TE6 | TE11 | −5 | 8.3 |
| Kyle Pitts | TE7 | TE24 | −17 | 6.7 |
| Sam LaPorta | TE8 | TE7 | +1 | 8.3 |
| George Kittle | TE9 | TE1 | +8 | 11.7 |
| Travis Kelce | TE10 | TE6 | +4 | 8.4 |
| Jake Ferguson | TE11 | TE37 | −26 | 5.1 |
| Isaiah Likely | TE12 | TE3 | +9 | 10.4 |
| Dalton Kincaid | TE13 | TE20 | −7 | 6.4 |
| Dallas Goedert | TE14 | TE14 | +0 | 7.8 |
| Mark Andrews | TE15 | TE32 | −17 | 5.7 |
| Brenton Strange | TE16 | TE13 | +3 | 7.0 |
| Juwan Johnson | TE17 | TE26 | −9 | 5.9 |
| Oronde Gadsden | TE18 | TE30 | −12 | 5.7 |
| Chigoziem Okonkwo | TE19 | TE8 | +11 | 8.3 |
| Hunter Henry | TE20 | TE28 | −8 | 6.5 |
| T.J. Hockenson | TE21 | TE18 | +3 | 6.6 |
| Dalton Schultz | TE23 | TE16 | +7 | 6.7 |
| AJ Barner | TE25 | TE12 | +13 | 7.9 |
| Cade Otton | TE28 | TE19 | +9 | 7.3 |
| Pat Freiermuth | TE30 | TE15 | +15 | 6.8 |