How does QB Performance Impact Other Position's Performance
For my first post of 2019, I am examining the performance of QB play on the other offensive positions. My goal is to provide the first steps in coming up with the 'shitty QB' factor I frequently mention in other posts. My hypothesis is: lousy QB play has a cascading effect on different offensive positions. My initial thoughts, before analysis is done are:
Bad QB play impacts every position negatively
Most models rank positions independently of each other, and we need to think about how the QB might perform when making roster decisions
I'd avoid most players on teams with a bad QB
Now for the fun part! Let's see what we can find.
For the dataset in this analysis, I am looking at every QB that had the most passing attempts in a game, and removing any position players that only received one or fewer targets/carries each game. I am trying to remove some of the fringe cases and 3rd-4th string guys in the data. Note-This is based on PPR scoring.
The tier of QB in all the analysis is based on the following logic:
- bad (0-10), average (10-15), good (15-20), and elite(20+)
I am going to have three main visualizations in this post.
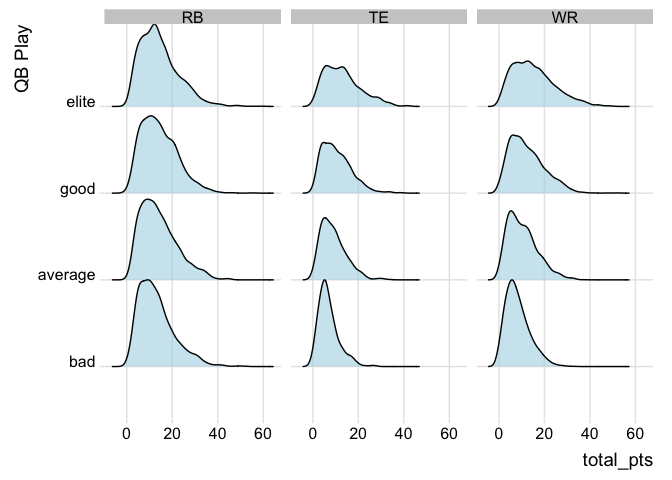
The first is below and will show the distribution of points scored by RB, TE, WR for each category of QB play.
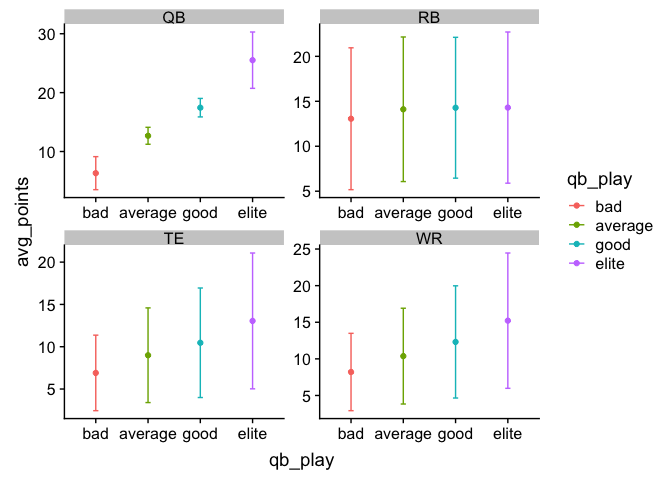
The second is the average points scored for each position for a given performance level of a QB.
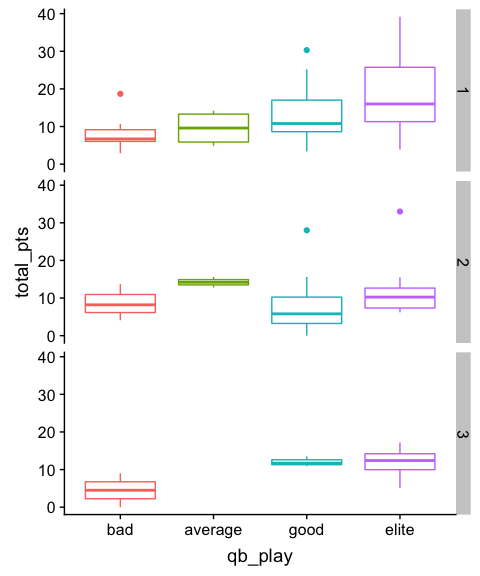
The third visualization will be a boxplot showing the points scored for WR based on their depth chart rank, faceted by QB performance
Point Distribution by Position
Some thoughts about the visual below:
For TE and WR, the worse the QB play, the higher the peak lower the average points amount.
- Meaning, most points scored are lower, on a per game basis.
RB is the lone exception where the ranges all look pretty similar except a more significant upside with better-performing QBs.
TE is a highly skewed position with a few elite players. The trend in the distribution of points tracks pretty similar to WR.
None of that analysis above surprises me (except for the RB part).
Average Points Scored by Position Based on QB Performance
This section will review the actual performance of positions based on the tier of quarterback performance.
The second figure (below) contains information about the average points per category of QB with error bars that are one standard deviation.
Remember, our categories are bad (0-10), average (10-15), good (15-20), and elite(20+).
Nothing here really jumps out except the appearance of little impact to RB average points between our different classifications of QB. If we revisit my initial thoughts, this finding ruins one of them.
The impact on TE and WR can't be ignored, especially when it comes to drafting someone. This harkens back to Demaryius Thomas's 2017 where his QB's weren't elite, and his overall stats suffered.
WR 1 with a Good/Great Quarterback or WR 2 with an Elite QB?
This section is in response to some questions I've been getting on this topic. Our data does not have official depth chart information historically. I do have depth chart information from week 5 - week 16, which is better than nothing.
- The graph below shows the distribution of
scores for WR based on the QBs in game performance.
- It's pretty hard to compare in that visualization, but it does look like WR2 with elite QB scores tend to perform as well as WR 1 on teams when the QB performance for the WR 2 is elite.
- The sample is tiny, but it's something I will keep up with next year.
A table containing summary stats for this data contained in the graph is below.
One item that is missing, you need to factor in the probability of an elite performance from a QB when making this type of roster decision. I wrote an article about that here.
Conclusion
For the first post on this topic, I am going to let the analysis ends here. This post is also the first on our site's blog (not using Medium), so I have a few issues to sort through with that. In conclusion, going into next year, I am going to look at valuations of WR and TE side by side with the estimate of the QB because there is a correlation between the two.